Training a Supervised Cilia Segmentation Model from Self-Supervision
Abstract
Cilia are organelles found on the surface of some cells in the human body that sweep rhythmically to transport substances. Dysfunctional cilia are indicative of diseases that can disrupt organs such as the lungs and kidneys. Understanding cilia behavior is essential in diagnosing and treating such diseases. But, the tasks of automatically analyzing cilia are often a labor and time-intensive since there is a lack of automated segmentation. In this work we overcome this bottleneck by developing a robust, self-supervised framework exploiting the visual similarity of normal and dysfunctional cilia. This framework generates pseudolabels from optical flow motion vectors, which serve as training data for a semi-supervised neural network. Our approach eliminates the need for manual annotations, enabling accurate and efficient segmentation of both motile and immotile cilia.
1Introduction
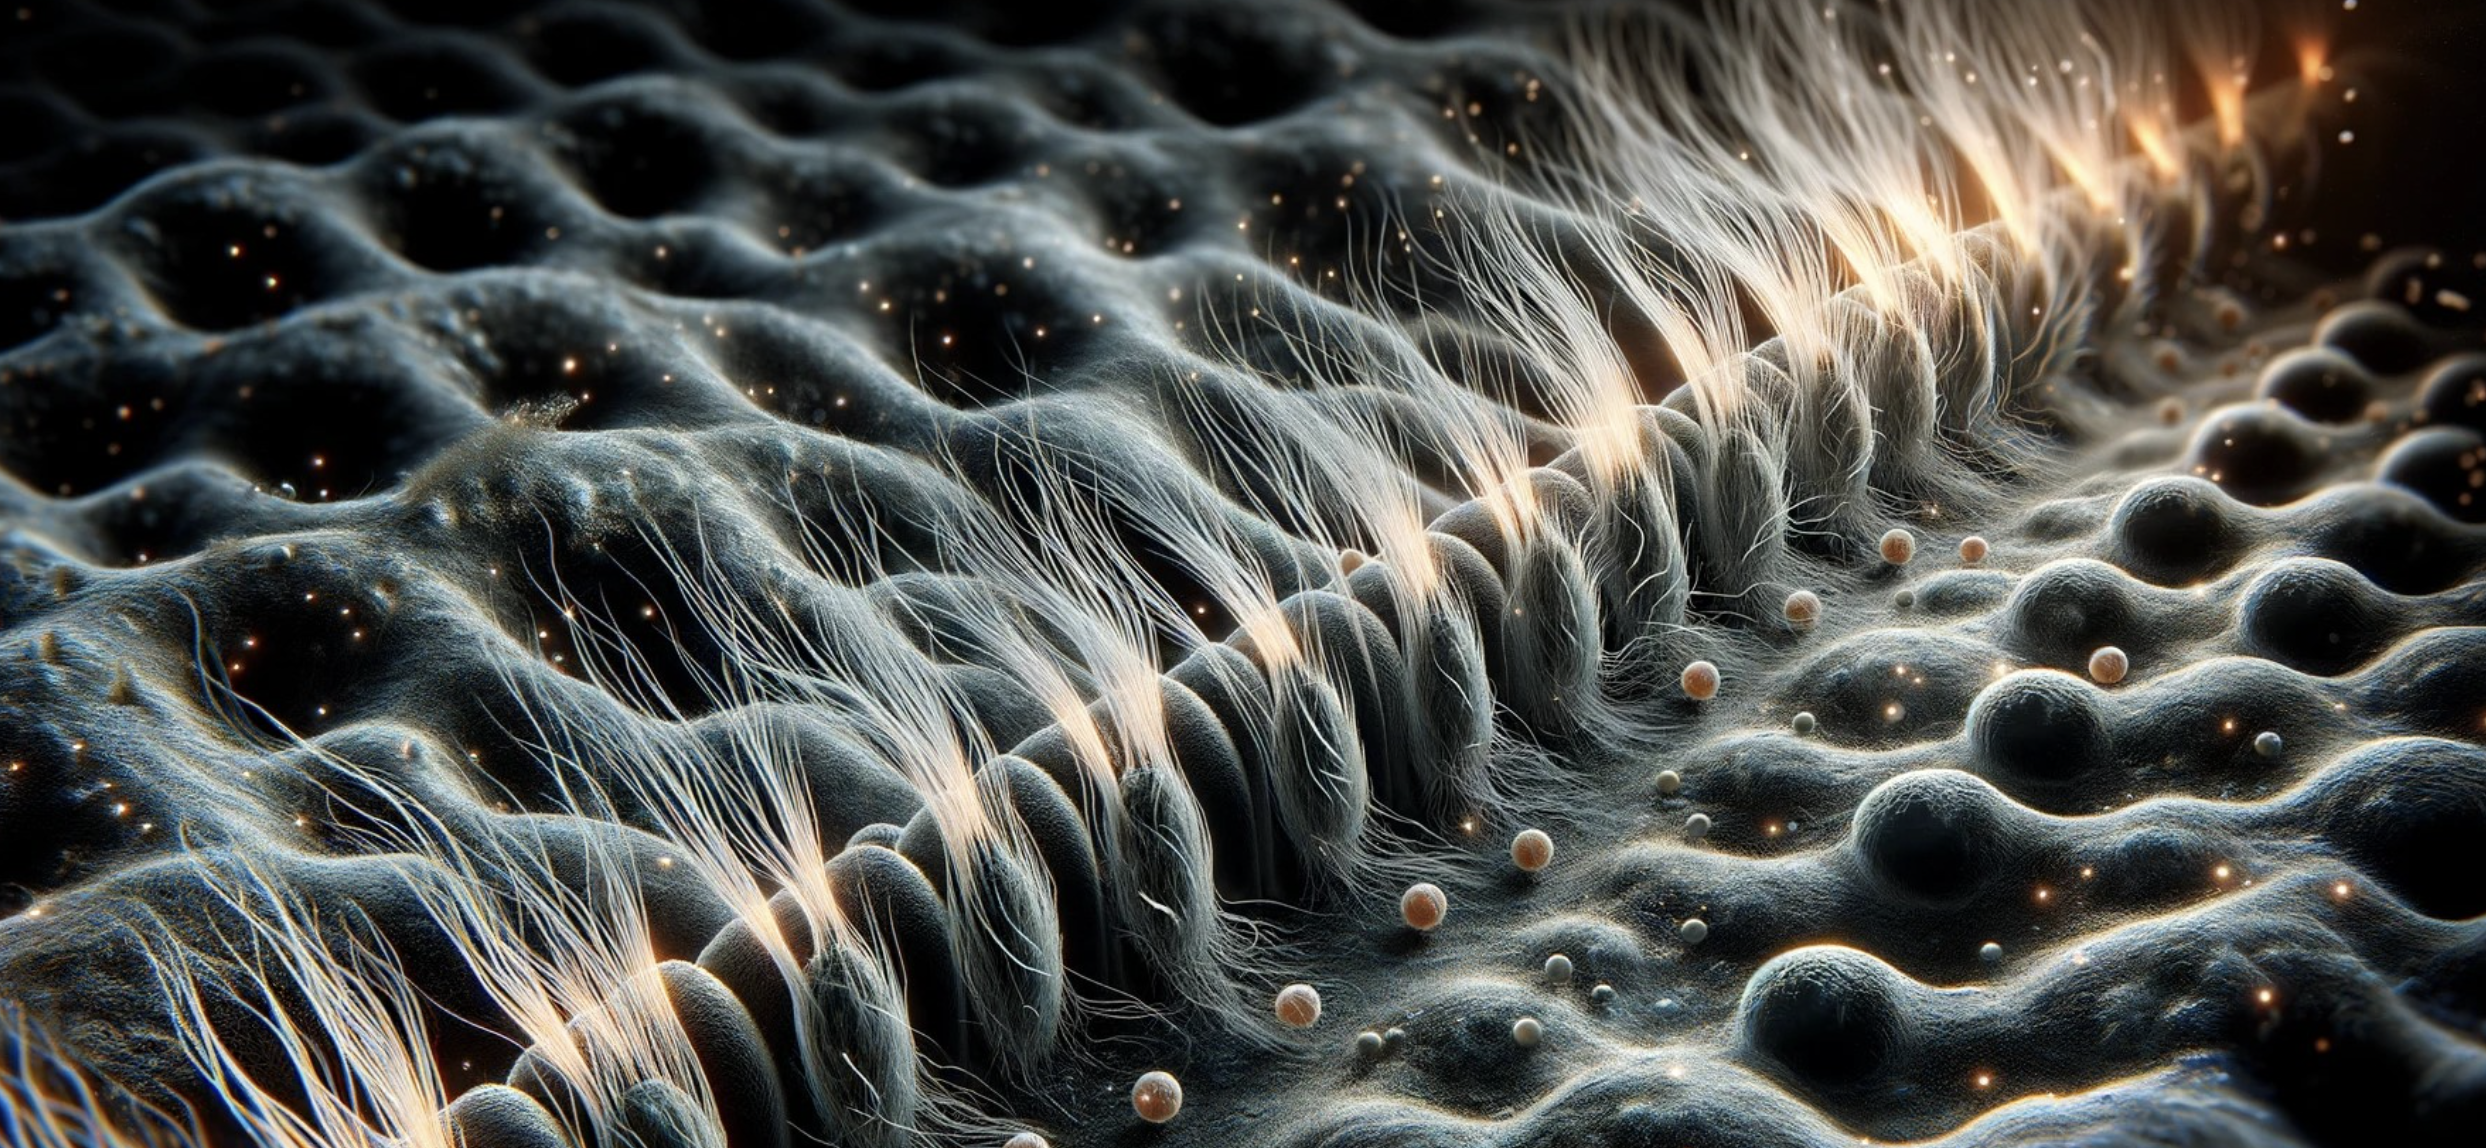
Cilia are hair-like membranes that extend out from the surface of the cells and are present on a variety of cell types such as lungs and brain ventricles and can be found in the majority of vertebrate cells. Categorized into motile and primary, motile cilia can help the cell to propel, move the flow of fluid, or fulfill sensory functions, while primary cilia act as signal receivers, translating extracellular signals into cellular responses Hoyer-Fender, 2013. Ciliopathies is the term commonly used to describe diseases caused by ciliary dysfunction. These disorders can result in serious issues such as blindness, neurodevelopmental defects, or obesity Hansen et al., 2021. Motile cilia beat in a coordinated manner with a specific frequency and pattern Lee et al., 2011. Stationary, dyskinetic, or slow ciliary beating indicates ciliary defects. Ciliary beating is a fundamental biological process that is essential for the proper functioning of various organs, which makes understanding the ciliary phenotypes a crucial step towards understanding ciliopathies and the conditions stemming from it Zain et al., 2022.
Identifying and categorizing the motion of cilia is an essential step towards understanding ciliopathies. However, this is generally an expert-intensive process. Studies have proposed methods that automate the ciliary motion assessment Zain et al., 2020. These methods rely on large amounts of labeled data that are annotated manually which is a costly, time-consuming, and error-prone task. Consequently, a significant bottleneck to automating cilia analysis is a lack of automated segmentation. Segmentation has remained a bottleneck of the pipeline due to the poor performance of even state-of-the-art models on some datasets. These datasets tend to exhibit significant spatial artifacts (light diffraction, out-of-focus cells, etc.) which confuse traditional image segmentation models Lu et al., 2018.
Video segmentation techniques tend to be more robust to such noise, but still struggle due to the wild inconsistencies in cilia behavior: while healthy cilia have regular and predictable movements, unhealthy cilia display a wide range of motion, including a lack of motion altogether Kempeneers & Chilvers, 2018. This lack of motion especially confounds movement-based methods which otherwise have no way of discerning the cilia from other non-cilia parts of the video. Both image and video segmentation techniques tend to require expert-labeled ground truth segmentation masks. Image segmentation requires the masks in order to effectively train neural segmentation models to recognize cilia, rather than other spurious textures. Video segmentation, by contrast, requires these masks in order to properly recognize both healthy and diseased cilia as a single cilia category, especially when the cilia show no movement.
To address this challenge, we propose a two-stage image segmentation model designed to obviate the need for expert-drawn masks. We first build a corpus of segmentation masks based on optical flow (OF) thresholding over a subset of healthy training data with guaranteed motility. We then train a semi-supervised neural segmentation model to identify both motile and immotile data as a single segmentation category, using the flow-generated masks as “pseudolabels”. These pseudolabels operate as “ground truth” for the model while acknowledging the intrinsic uncertainty of the labels. The fact that motile and immotile cilia tend to be visually similar in snapshot allows us to generalize the domain of the model from motile cilia to all cilia. Combining these stages results in a semi-supervised framework that does not rely on any expert-drawn ground-truth segmentation masks, paving the way for full automation of a general cilia analysis pipeline.
The rest of this article is structured as follows: The Background section enumerates the studies relevant to our methodology, followed by a detailed description of our approach in the Methodology section. Finally, the next section delineates our experiment and provides a discussion of the results obtained.
2Background
Dysfunction in ciliary motion indicates diseases known as ciliopathies, which can disrupt the functionality of critical organs like the lungs and kidneys. Understanding ciliary motion is crucial for diagnosing and understanding these conditions. The development of diagnosis and treatment requires the measurement of different cell properties including size, shape, and motility Vaezi et al., 2022.
Accurate analysis of ciliary motion is essential but challenging due to the limitations of manual analysis, which is labor-intensive, subjective, and prone to error. Zain et al., 2020 proposed a modular generative pipeline that automates ciliary motion analysis by segmenting, representing, and modeling the dynamic behavior of cilia, thereby reducing the need for expert intervention and improving diagnostic consistency. Quinn et al., 2015 developed a computational pipeline using dynamic texture analysis and machine learning to objectively and quantitatively assess ciliary motion, achieving over 90% classification accuracy in identifying abnormal ciliary motion associated with diseases like primary ciliary dyskinesia (PCD). Additionally, Zain et al., 2022 explored advanced feature extraction techniques like Zero-phase PCA Sphering (ZCA) and Sparse Autoencoders (SAE) to enhance cilia segmentation accuracy. These methods address challenges posed by noisy, partially occluded, and out-of-phase imagery, ultimately improving the overall performance of ciliary motion analysis pipelines. Collectively, these approaches aim to enhance diagnostic accuracy and efficiency, making ciliary motion analysis more accessible and reliable, thereby improving patient outcomes through early and accurate detection of ciliopathies. However, these studies rely on manually labeled data. The segmentation masks and ground-truth annotations, which are essential for training the models and validating their performance, are generated by expert reviewers. This dependence on manually labeled data is a significant limitation making automated cilia segmentation the bottleneck to automating cilia analysis.
In the biomedical field, where labeled data is often scarce and costly to obtain, several solutions have been proposed to augment and utilize available data effectively. These include semi-supervised learning @YAKIMOVICH2021100383, Van Engelen & Hoos, 2020, which utilizes both labeled and unlabeled data to enhance learning accuracy by leveraging the data’s underlying distribution. Active learning Settles, 2009 focuses on selectively querying the most informative data points for expert labeling, optimizing the training process by using the most valuable examples. Data augmentation techniques Chen et al., 2020Krois et al., 2021Yan et al., 2020Sandfort et al., 2019Yakimovich et al., 2021Van Dyk & Meng, 2001Krizhevsky et al., 2012Ronneberger et al., 2015, such as image transformations and synthetic data generation through Generative Adversarial Networks Goodfellow et al., 2014Yi et al., 2019, increase the diversity and volume of training data, enhancing model robustness and reducing overfitting. Transfer learning Yakimovich et al., 2021Sanford et al., 2020Raghu et al., 2019Hutchinson et al., 2017 transfers knowledge from one task to another, minimizing the need for extensive labeled data in new tasks. Self-supervised learning Kim et al., 2019Kolesnikov et al., 2019Mahendran et al., 2019 creates its labels by defining a pretext task, like predicting the position of a randomly cropped image patch, aiding in the learning of useful data representations. Additionally, few-shot, one-shot, and zero-shot learning techniques Li et al., 2006Miller et al., 2000 are designed to operate with minimal or no labeled examples, relying on generalization capabilities or metadata for making predictions about unseen classes.
A promising approach to overcome the dependency on manually labeled data is the use of unsupervised methods to generate ground truth masks. Unsupervised methods do not require prior knowledge of the data Khatibi et al., 2021. Using domain-specific cues unsupervised learning techniques can automatically discover patterns and structures in the data without the need for labeled examples, potentially simplifying the process of generating accurate segmentation masks for cilia. Inspired by advances in unsupervised methods for image segmentation, in this work, we firstly compute the motion vectors using optical flow of the ciliary regions and then apply autoregressive modelling to capture their temporal dynamics. Autoregressive modelling is advantageous since the labels are features themselves. By analyzing the OF vectors, we can identify the characteristic motion of cilia, which allows us to generate pseudolabels as ground truth segmentation masks. These pseudolabels are then used to train a robust semi-supervised neural network, enabling accurate and automated segmentation of both motile and immotile cilia.
3Methodology
Dynamic textures, such as sea waves, smoke, and foliage, are sequences of images of moving scenes that exhibit certain stationarity properties in time Doretto et al., 2003. Similarly, ciliary motion can be considered as dynamic textures for their orderly rhythmic beating. Taking advantage of this temporal regularity in ciliary motion, OF can be used to compute the flow vectors of each pixel of high-speed videos of cilia. In conjunction with OF, autoregressive (AR) parameterization of the OF property of the video yields a manifold that quantifies the characteristic motion in the cilia. The low dimension of this manifold contains the majority of variations within the data, which can then be used to segment the motile ciliary regions.
3.1Optical Flow Properties
Taking advantage of this temporal regularity in ciliary motion, we use OF to capture the motion vectors of ciliary regions in high-speed videos. OF provides the horizontal and vertical components of the motion for each pixel. From these motion vectors, several components can be derived such as the magnitude, direction, divergence, and importantly, the curl (rotation). The curl, in this context, represents the rotational motion of the cilia, which is indicative of their rhythmic beating patterns. We extract flow vectors of the video recording of cilia, under the assumption that pixel intensity remains constant throughout the video.
Where is the pixel intensity at position a time . Here, are small changes in the next frame taken after time, and , respectively, are the OF components that represent the displacement in pixel positions between consecutive frames in the horizontal and vertical directions at pixel location .

Figure 1:A sample of three videos in our cilia dataset with their manually annotated ground truth masks.

Figure 2:Representation of rotation (curl) component of OF at a random time
3.2Autoregressive Modeling
Figure 2 shows a sample of the OF component at a random time. From OF vectors, elemental components such as rotation are derived, which highlights the ciliary motion by capturing twisting and turning movements. To model the temporal evolution of these motion vectors, we employ an autoregressive (AR) model Hyndman et al., 2007. This model captures the dynamics of the flow vectors over time, allowing us to understand how the motion evolves frame by frame. The AR model helps in decomposing the motion into a low-dimensional subspace, which simplifies the complex ciliary motion into more manageable analyses.
In equation (2), represents the appearance of cilia at time influenced by noise . Equation (3) represents the state of the ciliary motion in a low-dimensional subspace defined by an orthogonal basis at time , plus a noise term and how the state changes from to .
Equation (3) is a decomposition of each frame of a ciliary motion video into a low-dimensional state vector using an orthogonal basis . This equation at position is a function of the sum of of its previous positions , each multiplied by its corresponding coefficients . The noise terms and are used to represent the residual difference between the observed data and the solutions to the linear equations. The variance in the data is predominantly captured by a few dimensions of , simplifying the complex motion into manageable analyses.
Each order of the autoregressive model roughly aligns with different frequencies within the data, therefore, in our experiments, we chose as the order of our autoregressive model. This choice allows us to capture a broader temporal context, providing a more comprehensive understanding of the system’s dynamics. We then created raw masks from this lower-dimensional subspace, and further enhanced them with adaptive thresholding to remove the remaining noise.
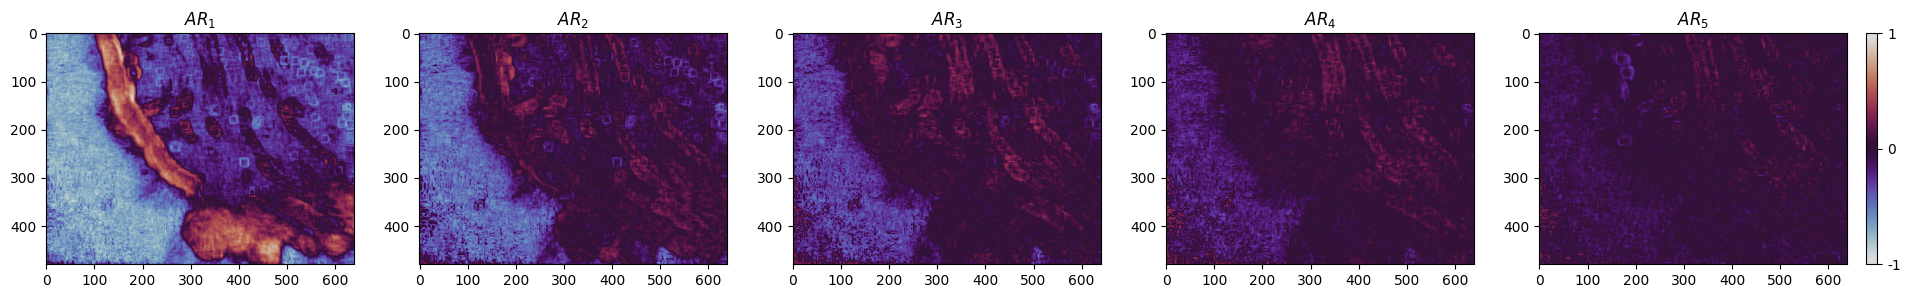
Figure 3:The pixel representation of the 5-order AR model of the OF component of a sample video. The and axes correspond to the width and height of the video.
In Figure 3, the first-order AR parameter is showing the most variance in the video, which corresponds to the frequency of motion that cilia exhibit. The remaining orders have correspondence with other different frequencies in the data caused by, for instance, camera shaking. Evidently, simply thresholding the first-order AR parameter is adequate to produce an accurate mask, however, in order to get a more refined result we subtracted the second order from the first one, followed by a Min-Max normalization of pixel intensities and scaling to an 8-bit unsigned integer range. We used adaptive thresholding to extract the mask on all videos of our dataset. The generated masks exhibited under-segmentation in the ciliary region, and sparse over-segmentation in other regions of the image. To overcome this, we adapted a Gaussian blur filter followed by an Otsu thresholding to restore the under-segmentation and remove the sparse over-segmentation. Figure 4 illustrates the steps of the process.

Figure 4:The process of computing the masks. a) Subtracting the second-order AR parameter from the first-order, followed by b) Adaptive thresholding, which suffers from under/over-segmentation. c) A Gaussian blur filter, followed by d) An Otsu thresholding eliminates the under/over-segmentation.
3.3Training the model
Our dataset includes 512 videos, with 437 videos of dyskinetic cilia and 75 videos of healthy motile cilia, referred to as the control group. The control group is split into %85 and %15 for training and validation respectively. 108 videos in the dyskinetic group are manually annotated which are used in the testing step. Figure 1 shows annotated samples of our dataset.
In our study, we employed a Feature Pyramid Network (FPN) Kirillov et al., 2017 architecture with a ResNet-34 encoder. The model was configured to handle grayscale images with a single input channel and produce binary segmentation masks. For the training input, one mask is generated per video using our methodology, and we use all of the frames from each video in the control group making a total of 33,964 input images. We utilized Binary Cross-Entropy Loss for training and the Adam optimizer with a learning rate of 10-3. To evaluate the model’s performance, we calculated the Dice score during training and validation. Data augmentation techniques, including resizing, random cropping, and rotation, were applied to enhance the model’s generalization capability. The implementation was done using a library Iakubovskii, 2019 based on PyTorch Lightning to facilitate efficient training and evaluation. Table 1 contains a summary of the model parameters and specifications.
The next section discusses the results of the experiment and the performance of the model in detail.
Table 1:Summary of model architecture, training setup, and dataset distribution
| Aspect | Details |
|---|---|
| Architecture | FPN with ResNet-34 encoder |
| Input | Grayscale images with a single input channel |
| Batch Size | 2 |
| Training Samples | 28,869 |
| Validation Samples | 5,095 |
| Test Samples | 108 |
| Loss Function | Binary Cross-Entropy Loss |
| Optimizer | Adam optimizer with a learning rate of 10-3 |
| Evaluation Metric | Dice score during training, validation, and testing |
| Data Augmentation Techniques | Resizing, random cropping, and rotation |
| Implementation | Using a Python library with Neural Networks for Image Segmentation based on PyTorch Iakubovskii, 2019 |
4Results and Discussion
The model’s performance metrics, including IoU, Dice score, sensitivity, and specificity, are summarized in Table 2. The validation phase achieved an IoU of 0.398 and a Dice score of 0.569, which indicates a moderate overlap between the predicted and ground truth masks. The high sensitivity (0.997) observed during validation suggests that the model is proficient in identifying ciliary regions, albeit with a specificity of 0.882, indicating some degree of false positives. In the testing phase, the IoU and Dice scores decreased to 0.132 and 0.233, respectively, reflecting the challenges posed by the dyskinetic cilia data, which were not included in the training or validation sets. Despite this, the model maintained a sensitivity of 0.479 and specificity of 0.806.

Figure 5:The model predictions on 5 dyskinetic cilia samples. The first column shows a frame of the video, the second column shows the manually labeled ground truth, the third column is the model’s prediction, and the last column is a thresholded version of the prediction.
Figure 5 provides visual examples of the model’s predictions on dyskinetic cilia samples, alongside the manually labeled ground truth and thresholded predictions. The dyskinetic samples were not used in the training or validation phases. These predictions were generated after only 15 epochs of training with a small training data. The visual comparison reveals that, while the model captures the general structure of ciliary regions, there are instances of under-segmentation and over-segmentation, which are more pronounced in the dyskinetic samples. This observation is consistent with the quantitative metrics, suggesting that further refinement of the pseudolabel generation process or model architecture could enhance segmentation accuracy.
Table 2:The performance of the model in validation and testing phases after 15 epochs of training.
| Phases | Metrics | |||
|---|---|---|---|---|
| IoU over dataset | Dice Score | Sensitivity | Specificity | |
| Validation | 0.398 | 0.569 | 0.997 | 0.882 |
| Testing | 0.132 | 0.233 | 0.479 | 0.806 |
4.1Training the model using control and dyskinetic data
Since dyskinetic videos contain cilia that show some degree of movement we generated pseudo-labels for 283 dyskinetic videos and used them along with the 76 control videos from the previous experiment in another experiment. Training the model again for 15 epochs over healthy and dyskinetic videos exhibited a loss of performance in the validation phase, however, in the testing phase all of the metrics improved except for the specificity. Since in this experiment the model was trained on an additional subset of the dyskinetic videos, improved performance in detecting and masking dyskinetic ciliary regions is expected. The results are depicted in Table 3.
Table 3:The performance of the model after retraining with an addition of 283 videos of dyskinetic cilia to the training dataset.
| Phases | Metrics | |||
|---|---|---|---|---|
| IoU over dataset | Dice Score | Sensitivity | Specificity | |
| Validation | 0.202 | 0.337 | 0.999 | 0.765 |
| Testing | 0.139 | 0.245 | 0.732 | 0.696 |
After using the model to infer more samples we detected a pattern for how the model performs in regions with specific visual properties. We observed that the model can more successfully and more accurately detect ciliary regions in images where they appear sharp and in focus, and do not overlap other cellular structures. On the other hand, as shown in all samples in Figure 5, the most number of false negatives occur where the ciliary regions are in close proximity to other cellular structures or overlapping them. Furthermore, the most false positives occur along sharp cellular borders. Cell borders are most where cilia can be found the most in the videos, and the model may have learnt to look for or prioritize sharp cell borders and boundaries as ciliary regions. More investigation is required to further examine whether the model’s attention mechanism or feature extraction layers are overly biased towards sharp edges and boundaries, potentially leading to incorrect predictions. This investigation could involve analyzing the model’s learned features, adjusting training strategies, or incorporating additional data augmentation techniques to improve its performance in complex regions.
The results show the potential of our approach to reduce the reliance on manually labeled data for cilia segmentation. The use of this unsupervised learning framework allows the model to generalize from the motile cilia domain to the more variable dyskinetic cilia, although with some limitations in accuracy. Future work could focus on expanding the dataset and improving the process of generating pseudolabels to enhance the model’s accuracy.
5Conclusions
In this paper, we introduced a self-supervised framework for cilia segmentation that eliminates the need for expert-labeled ground truth segmentation masks. Our approach takes advantage of the inherent visual similarities between healthy and unhealthy cilia to generate pseudolabels from optical flow-based motion segmentation of motile cilia. These pseudolabels are then used as ground truth for training a semi-supervised neural network capable of identifying regions containing dyskinetic cilia. Our results indicate that the self-supervised framework is a promising step towards automated cilia analysis. The model’s ability to generalize from motile to dyskinetic cilia demonstrates its potential applicability in clinical settings. Although there are areas for improvement, such as enhancing segmentation accuracy and expanding the dataset, the framework sets the foundation for more efficient and reliable cilia analysis pipelines.
Copyright © 2024 Vaezi & Quinn. This is an open-access article distributed under the terms of the Creative Commons Attribution 4.0 International license, which enables reusers to distribute, remix, adapt, and build upon the material in any medium or format, so long as attribution is given to the creators.
- AR
- autoregressive
- FPN
- Feature Pyramid Network
- OF
- optical flow
- PCD
- primary ciliary dyskinesia
- SAE
- Sparse Autoencoders
- ZCA
- Zero-phase PCA Sphering
- Hoyer-Fender, S. (2013). Primary and Motile Cilia: Their Ultrastructure and Ciliogenesis. In K. L. Tucker & T. Caspary (Eds.), Cilia and Nervous System Development and Function (pp. 1–53). Springer Netherlands. 10.1007/978-94-007-5808-7_1
- Hansen, J. N., Rassmann, S., Stüven, B., Jurisch-Yaksi, N., & Wachten, D. (2021). CiliaQ: a simple, open-source software for automated quantification of ciliary morphology and fluorescence in 2D, 3D, and 4D images. The European Physical Journal E, 44(2), 18. https://doi.org/10.1140/epje/s10189-021-00031-y
- Lee, W., Jayathilake, P., Tan, Z., Le, D., Lee, H., & Khoo, B. (2011). Muco-ciliary transport: effect of mucus viscosity, cilia beat frequency and cilia density. Computers & Fluids, 49(1), 214–221. https://doi.org/10.1016/j.compfluid.2011.05.016
- Zain, M., Miller, E., Quinn, S., & Lo, C. (2022). Low Level Feature Extraction for Cilia Segmentation. Proceedings of the Python in Science Conference. https://doi.org/10.25080/majora-212e5952-026
- Zain, M., Rao, S., Safir, N., Wyner, Q., Humphrey, I., Eldridge, A., Li, C., AlAila, B., & Quinn, S. (2020). Towards an unsupervised spatiotemporal representation of cilia video using a modular generative pipeline. Proceedings of the Python in Science Conference. http://dx.doi.org/10.25080/Majora-342d178e-017
- Lu, C., Marx, M., Zahid, M., Lo, C. W., Chennubhotla, C., & Quinn, S. P. (2018). Stacked Neural Networks for end-to-end ciliary motion analysis. arXiv Preprint arXiv:1803.07534. https://doi.org/10.48550/arXiv.1803.07534
- Kempeneers, C., & Chilvers, M. A. (2018). To beat, or not to beat, that is question! The spectrum of ciliopathies. Pediatric Pulmonology, 53(8), 1122–1129. https://doi.org/10.1002/ppul.24078
- Vaezi, S. A., Orlando, G., Fazli, M. S., Ward, G. E., Moreno, S. N., & Quinn, S. (2022). A Novel Pipeline for Cell Instance Segmentation, Tracking and Motility Classification of Toxoplasma Gondii in 3D Space. SciPy, 60–63. https://doi.org/10.25080/majora-212e5952-009
- Quinn, S. P., Zahid, M. J., Durkin, J. R., Francis, R. J., Lo, C. W., & Chennubhotla, S. C. (2015). Automated identification of abnormal respiratory ciliary motion in nasal biopsies. Science Translational Medicine, 7(299), 299ra124-299ra124. http://dx.doi.org/10.1126/scitranslmed.aaa1233
- Van Engelen, J. E., & Hoos, H. H. (2020). A survey on semi-supervised learning. Machine Learning, 109(2), 373–440. http://dx.doi.org/10.1007/s10994-019-05855-6
- Settles, B. (2009). Active learning literature survey.
- Chen, C., Bai, W., Davies, R. H., Bhuva, A. N., Manisty, C. H., Augusto, J. B., Moon, J. C., Aung, N., Lee, A. M., Sanghvi, M. M., Fung, K., Paiva, J. M., Petersen, S. E., Lukaschuk, E., Piechnik, S. K., Neubauer, S., & Rueckert, D. (2020). Improving the Generalizability of Convolutional Neural Network-Based Segmentation on CMR Images. Frontiers in Cardiovascular Medicine, 7. https://doi.org/10.3389/fcvm.2020.00105
- Krois, J., Garcia Cantu, A., Chaurasia, A., Patil, R., Chaudhari, P. K., Gaudin, R., Gehrung, S., & Schwendicke, F. (2021). Generalizability of deep learning models for dental image analysis. Scientific Reports, 11(1), 6102. http://dx.doi.org/10.1038/s41598-021-85454-5
- Yan, W., Huang, L., Xia, L., Gu, S., Yan, F., Wang, Y., & Tao, Q. (2020). MRI Manufacturer Shift and Adaptation: Increasing the Generalizability of Deep Learning Segmentation for MR Images Acquired with Different Scanners. Radiology: Artificial Intelligence, 2(4), e190195. 10.1148/ryai.2020190195
- Sandfort, V., Yan, K., Pickhardt, P. J., & Summers, R. M. (2019). Data augmentation using generative adversarial networks (CycleGAN) to improve generalizability in CT segmentation tasks. Scientific Reports, 9(1), 16884. https://doi.org/10.1016/j.imu.2021.100779