Cyanobacteria detection in small, inland water bodies with CyFi
Using satellite imagery and machine learning to protect public health
Abstract
Harmful algal blooms (HABs) pose major health risks to human and aquatic life. Remote sensing-based methods exist to automatically detect large, slow-moving HABs in the ocean, but fall short for smaller, more dynamic blooms in critical inland water bodies like lakes, reservoirs, and rivers.
CyFi is an open-source Python package that enables detection of cyanobacteria in inland water bodies using 10-30m Sentinel-2 imagery and a computationally efficient tree-based machine learning model. CyFi enables water quality and public health managers to conduct high level assessments of water bodies of interest and identify regions in which to target monitoring and responsive actions to protect public health.
CyFi was developed in three phases. A machine learning competition leveraged the diverse skills and creativity of data science experts to surface promising approaches for cyanobacteria detection from remote sensed data. Subsequent user interviews and model iteration resulted in a deployment-ready open-source package designed to meet user workflow needs and decision-making priorities. This process illustrates a replicable pathway for developing powerful machine learning tools in domain-specific areas.
1Introduction
Inland water bodies provide a variety of critical services for both human and aquatic life, including drinking water, recreational and economic opportunities, and marine habitats. Harmful algal blooms (HABs) pose a significant risk to these inland bodies, producing toxins that are poisonous to humans and their pets and threatening marine ecosystems by blocking sunlight and oxygen. Such threats require water quality managers to monitor for the presence of HABs and to make urgent decisions around public health warnings and closures when they are detected.
The most common source of HABs in freshwater environments is cyanobacteria, or blue-green algae CDC, n.d.. While there are established methods for using satellite imagery to detect cyanobacteria in larger water bodies like oceans, detection in small inland lakes, reservoirs, and rivers remains a challenge. Manual water sampling is accurate, but is too time and resource intensive to perform continuously at scale. Machine learning models, on the other hand, can generate estimates in seconds. Automatic detection enables water managers to better prioritize limited manual sampling resources and can provide a birds-eye view of water conditions across a region Papenfus et al., 2020. Machine learning is particularly well-suited to this task because indicators of cyanobacteria are visible in free, routinely collected satellite imagery.
We present CyFi, short for Cyanobacteria Finder, an open-source Python package that uses satellite imagery and machine learning to estimate cyanobacteria levels in inland water bodies DrivenData, 2024. CyFi helps decision makers protect the public by flagging the highest-risk areas in lakes, reservoirs, and rivers quickly and easily. CyFi represents a significant advancement in environmental monitoring, providing higher-resolution detection capabilities that can pinpoint areas at risk of cyanobacterial contamination. Key strengths of CyFi compared to other tools include:
- Features derived from high-resolution Sentinel-2 satellite data
- A fast and computationally efficient boosted tree machine learning algorithm
- A straightforward command line interface
- A unique training dataset of almost 13,000 cyanobacteria ground measurements across the continental U.S.
This paper presents a detailed examination of the development of CyFi, from its origins in a machine learning competition to an open source package. The methods section explores the setup of the prize competition, the subsequent model experimentation phase that built on winning approaches, and the end user interviews that helped shape CyFi with real-world context. The results section provides insights on the machine learning methods that proved most effective for detecting inland HABs, and details CyFi’s underlying methodology, core capabilities, and model performance. Finally, the discussion section reflects the primary ways CyFi can augment human decision making workflows to protect public health and notes areas for future research.
2Motivation
There are tens of thousands of lakes that matter for recreation and drinking water. Cyanobacterial blooms pose real risks in many of them, and we really don’t know when or where they show up, except in the largest lakes.
Dr. Rick Stumpf, Oceanographer, NOAA, National Centers for Coastal Ocean Science[1]
Harmful algal blooms are a pressing environmental and public health issue, characterized by the rapid and excessive growth of algae in water bodies. These blooms can produce toxins, such as microcystins and anatoxins, that pose severe risks to human health, aquatic ecosystems, and local economies Pulido, 2016.
The toxins released by HABs can contaminate drinking water supplies, leading to acute and chronic health problems for communities Treuer et al., 2021. Exposure to these toxins through ingestion, skin contact, or inhalation can result in a variety of acute and chronic health issues, including gastrointestinal illnesses, liver damage, neurological effects, and even death in extreme cases Lad et al., 2022.
Ecologically, HABS can create hypoxic (low oxygen) conditions in water bodies, resulting in massive fish kills and the disruption of aquatic food webs Watson et al., 2016. HABs can form dense algal mats that block sunlight, inhibiting the growth of submerged vegetation essential for aquatic habitats. Furthermore, the decomposition of large algal blooms consumes significant amounts of dissolved oxygen, exacerbating oxygen depletion and leading to dead zones where most aquatic life cannot survive.
These ecological impacts can have devastating economic consequences for local industries reliant on water resources, such as fisheries, tourism, and recreation. Beaches and lakeside areas affected by algal blooms often face closures, leading to a loss of revenue. The cost of managing and mitigating the effects of HABs, including water treatment and healthcare expenses, places additional financial burdens on affected communities Hoagland et al., 2009Hoagland et al., 2002.
Despite the severe consequences of HABs, existing monitoring tools and methods are often insufficient. Traditional approaches, such as manual water sampling and laboratory analysis, are time-consuming, labor-intensive, and provide only localized snapshots of water quality.
Existing satellite-based monitoring tools offer broad coverage but fall short of the spatial resolution needed for small inland water bodies. Most are aimed at monitoring blooms in the ocean, which are larger and slower moving. Many of the leading satellite-based methods for cyanobacteria detection rely on chlorophyll estimates using the Ocean and Land Colour Instrument (OLCI) on Sentinel-3 Khan et al., 2021. However, the coarse 300m resolution of Sentinel-3 only recognizes approximately 5% of inland water bodies in the continental U.S. Clark et al., 2017 and therefore is not able to provide the data needed for effective early warning and rapid response to HAB outbreaks in lakes, reservoirs, and rivers. In addition, chlorophyll is an imperfect proxy for cyanobacteria as all types of algae contain chlorophyll-a, including non-harmful blooms Ohio Environmental Protection Agency, 2022.
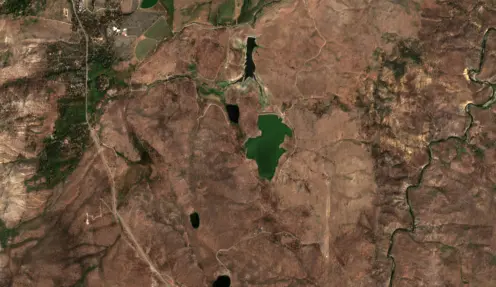
Figure 1:An example of a water body at 10m resolution
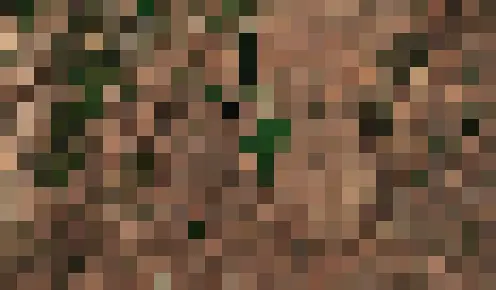
Figure 2:An example of the Figure 1 image at 300m resolution
The effects of climate change are likely to increase both the frequency and severity of HABs in inland water bodies. Warmer water temperatures, higher concentrations of carbon dioxide, runoff and coastal upswelling related to extreme weather events, and sea level rise can all contribute to making freshwater nutrients levels and environmental conditions more conducive to the growth of harmful algae United States Environmental Protection Agency, 2024.
Effectively monitoring inland HABs and protecting public health requires developing new innovative tools that capture a higher spatial resolution, can be run quickly and frequently, and are accessible to decision makers. CyFi aims to fill this gap by incorporating higher-resolution satellite imagery, an efficient tree-based model, and a user-friendly command line interface.
3Methods
3.1Machine learning competition
The machine learning approach in CyFi was originally developed as part of the Tick Tick Bloom: Harmful Algal Detection Challenge, which ran from December 2022 to February 2023 DrivenData, 2023. Machine learning competitions can harness the power of community-driven innovation and rapidly test a wide variety of possible data sources, model architectures, and features Bull et al., 2016Da Poian et al., 2024Johnson et al., 2021. Tick Tick Bloom was created by DrivenData on behalf of NASA and in collaboration with NOAA, the U.S. Environmental Protection Agency, the U.S. Geological Survey, the U.S. Department of Defense Defense Innovation Unit, Berkeley AI Research, and Microsoft AI for Earth.
In the Tick Tick Bloom challenge, over 1,300 participants competed to detect cyanobacteria blooms in small, inland water bodies using publicly available satellite, climate, and elevation data. Models were trained and evaluated using a set of manually collected water samples that had been analyzed for cyanobacteria density. Labels were sourced from 14 data providers across the U.S., shown in Figure 3. The full dataset containing 23,570 in situ cyanobacteria measurements is publicly available through the SeaBASS data archive Gupta et al., 2024. Each observation in the dataset is a unique combination of date, latitude, and longitude.
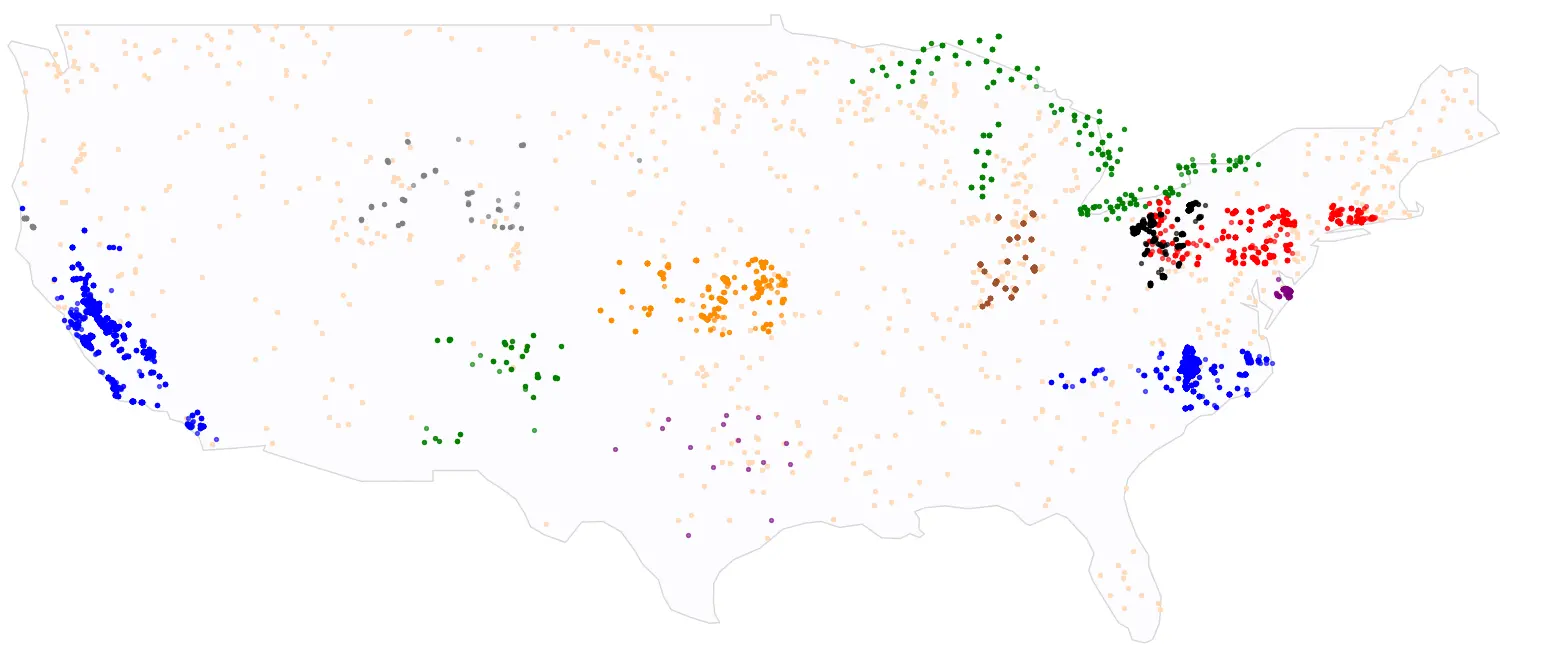
Figure 3:Labeled samples used in the Tick Tick Bloom competition colored by dataset provider.
The labels were divided into train and set sets, where 17,060 train labels were provided to participants and 6,510 test labels were used to evaluate model performance and kept confidential from participants. Lakes in close proximity can experience similar bloom-forming conditions, presenting a risk of leakage. To address this, clustering methods were used to maximize the distance between every train set point and every test set point, decreasing the likelihood that participants could gain insight into any test point density based on the training set. Scikit-learn’s DBSCAN algorithm Pedregosa et al., 2011Ester et al., 1996 was used to divide all data points into spatial clusters. Each cluster was then randomly assigned to either the train or test dataset, such that no test data point was within 15 kilometers of a train data point.
Participants predicted a severity category for a given sampling point as shown in Table 1. These ranges were informed by EPA and WHO guidelines Office of Water, 2019World Health Organization, 2003.
Table 1:Severity categories used in the Tick Tick Bloom competition
| Severity level | Cyanobacteria density range (cells/mL) |
|---|---|
| 1 | 20,000 |
| 2 | 20,000 – 100,000 |
| 3 | 100,000 – 1,000,000 |
| 4 | 1,000,000 – 10,000,000 |
| 5 | 10,000,000 |
Predictions were evaluated using region-averaged root mean squared error. Averaging across regions incentivized models to perform well across the continental U.S., rather than in certain states that were over-represented in the competition dataset (such as California and North Carolina). Over 900 submissions across 115 teams were made over the course of the competition.
3.2Carrying forward competition models
Machine learning competitions are excellent for crowd-sourcing top approaches to complex predictive modeling problems. Over a short period of time, a large community of solvers tests a broad feature space including possible data sources, model architectures, and model features. The result is an open-source github repository with code from the most effective approaches, trained model weights, and write-ups of winning methods.
However, transforming this research code into production code requires significant additional work. There are a few key differences between competition-winning research approaches and deployable code:
- The competition relies on static data exported and processed once while deployment requires repeated, automatic use with new data.
- Winning models are relatively unconstrained by the size and cost of their solutions. For ongoing use, efficiency matters.
- Competition code is validated once with anticipated, clean data and static versions of Python package dependencies. In the real world things break and change; use requires basic robustness, testing and configurability.
- There is substantial variability in the clarity and organization of competition-winning code. Usable code requires others to be able to understand, maintain, and build on the codebase.
The end goal is regularly generated predictions of cyanobacteria levels surfaced in user-friendly dashboards to water quality managers. To achieve this, the intermediate requirement is a deployment-ready code package. This package is CyFi, a configurable, open-source Python library capable of generating cyanobacteria predictions on new input data.
3.2.1Model experimentation
CyFi was developed through an additional model experimentation phase, which combined and iterated on the most useful pieces from competition-winning models, and simplified and restructured code to transform it into a runnable pipeline.[2] Additional model testing helped determine which winning approaches were the most robust, accurate, and generalizable outside of the competition setting.
The table below summarizes the matrix of experiments that were conducted. Model experimentation informed key decisions around which data sources were used, how satellite imagery was selected and processed, and which target variable was predicted.
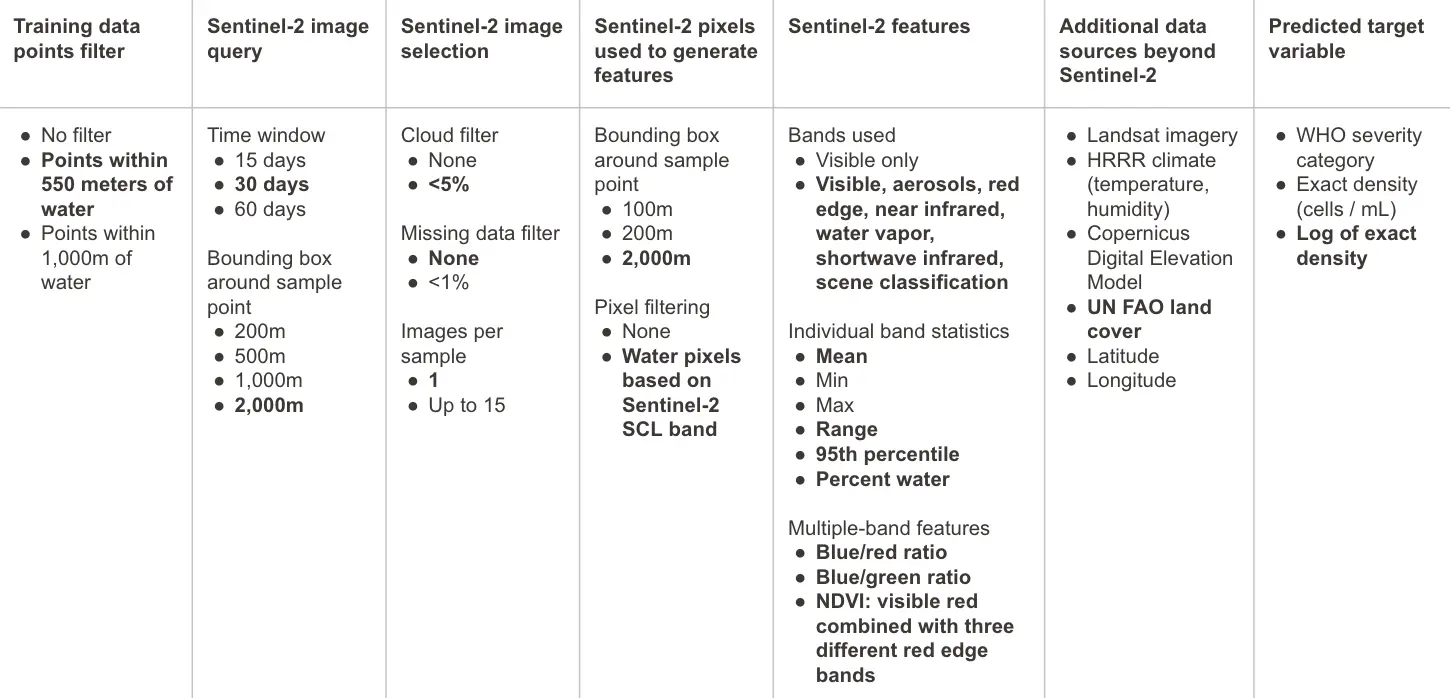
Figure 4:Model experimentation summary, with final selections in bold.
During experimentation the competition train-test split was maintained, but samples prior to the launch of Sentinel-2 as well as sampling points more than 550m away from a water body were removed, as outlined in Table 3. This resulted in a final train set size of 8,979 points and a test set size of 4,035 points.
StratifiedGroupKFold was used to create five train and validation folds stratified on region (cyfi/pipeline.py) and a model was trained on each fold. Predictions are averaged across the five models. Early stopping based on performance on the validation set was used to prevent overfitting.
Performance on the test set was evaluated based on a combination of root mean squared error, mean absolute error, mean absolute percentage error, and regional root mean squared error, along with manual review and visualizations of predictions. Standard best practices were used to inform hyperparameters tuning for the final model.
3.2.2User interviews
To design a package that optimally addresses on-the-ground user needs, we conducted human-centered design (HCD) interviews with subject matter experts and end users. Interviewees included water quality and public health experts from California, New York, Georgia, Louisiana, Florida, and Michigan. Representatives from these states were selected to understand workflows and priorities, and capture a diversity of geographic locations, number of water bodies in the region, HAB severity, investment in HABs monitoring, and technical sophistication of current approaches. User interviews focused on understanding current water quality decision-making processes, including the data and tools used to support those decisions. Learnings were used to inform the format for surfacing predictions, priorities in model performance, and computational constraints. Table 6 summarizes the core design decisions for CyFi that were rooted in insights from user interviews.
4Results
4.1Competition takeaways
The overarching goal of the Tick Tick Bloom: Harmful Algal Bloom Detection Challenge was to identify the most useful data sources, features, and modeling methods for cyanobacteria estimation in small, inland water bodies. There was particular interest around the use of Sentinel-2 data, which has significantly higher resolution than Sentinel-3 and is more suited to smaller water bodies. However, Sentinel-2 does not contain the bands historically used to derive cyanobacteria estimates.
The competition showed that Sentinel-2 bands contain sufficient information for generating accurate cyanobacteria estimates with machine learning. Below is a summary of which datasets were used by winners.
Table 2:Data sources used by Tick Tick Bloom competition winners
| Landsat Satellite | Sentinel 2 Satellite | HRRR Climate data | Copernicus DEM Elevation | Metadata Time, location | |
|---|---|---|---|---|---|
| 1st Place | ✔ Color value statistics | ✔ Temperature | ✔ Region Location | ||
| 2nd Place | ✔ Color value statistics | ✔ | ✔ Clustered location | ||
| 3rd Place | ✔ Color value statistics | ✔ Color value statistics | ✔ Temperature Humidity | ✔ Longitude |
All winners used Level-2 satellite imagery instead of Level-1, likely because it already includes useful atmospheric corrections. Sentinel-2 data is higher resolution than Landsat, and proved to be more useful in modeling.
All winners also used gradient boosted decision tree models such as LightGBM Ke et al., 2017, XGBoost Chen & Guestrin, 2016, and CatBoost Dorogush et al., 2018. First place explored training a CNN model but found the coarse resolution of the satellite imagery overly constraining, particularly when using Landsat imagery. Despite deep learning models often being thought of as the go-to for image data, decision tree models can work particularly well with satellite imagery where the task is point estimation rather than segmentation.[3] Decision tree models also have a number of advantages over deep learning models as they boast faster training and inference, do not require a GPU, and provide greater interpretability. This enables more rapid experimentation and iteration in training and supports near real-time inference using limited compute.
4.2Model experimentation takeaways
The model experimentation phase did not explore alternate model architectures given how clearly the competition surfaced the success of a gradient boosted tree model DrivenData, 2023. It did however extensively iterate on other parts of the pipeline. Over 30 configurations were tested to identify the optimal setup for training a robust, generalizable model. Below are the core decisions that resulted from model experimentation and retraining.
4.2.1Data decisions
Table 3:Data decisions from model experimentation
| Decision | Explanation |
|---|---|
| Filter points farther than 550m from a water body | A small amount of noise in the competition dataset was caused by a combination of human error, GPS device error, or a lack of adequate precision in recorded latitude and longitude. Excluding points that are farther than 500m from a water body helps ensure that the model learns from real-world environmental characteristics of cyanobacteria blooms rather than patterns in human error (see below for additional details). Applying this filter decreased the train set size from 17,060 to 11,299 and the test set size from 6,510 to 4,938. |
| Use Sentinel-2 as the sole satellite source | Landsat data primarily only added value for the time period prior to July 2015, when Sentinel-2 data became available. Most applications of CyFi will be forward looking, meaning Sentinel-2 data will be available. As the slowest part of the prediction process is downloading satellite data, incorporating Landsat as a second data source would impose a significant efficiency cost. To rely only on Sentinel-2, any samples prior to the launch of Sentinel-2 were removed from the training and evaluation sets. This further decreased the train set size from 11,299 to 8,979 and the test set size from 4,938 to 4,035. |
| Exclude climate and elevation features | Climate and elevation features primarily provided value for data points prior to the launch of Sentinel-2 and so are not used in the final CyFi model. Climate and elevation likely do have an impact on how cyanobacteria blooms form, and more sophisticated feature engineering with these data sources may add value in the future. This is a direction for future research. |
| Incorporate land cover | Including a land cover map, even at a coarse 300m resolution, aided model accuracy. The land cover map captures farmland areas with fertilizer runoff that contributes to blooms, among other features. A static map from 2020 is used rather than a real-time satellite-derived product, as this reduces the compute time and patterns in land use do not fluctuate daily. Land cover is also an effective balance between reflecting regional characteristics, and avoiding overfitting to the small number data providers in the training set. |
One of the risks in a machine learning competition is overfitting to the test set. Competition models may pick up on patterns specific to the competition data, rather than patterns of environmental cyanobacteria conditions that generalize outside of the competition. The experimentation phase worked to identify and remove competition artifacts that would hamper the generalizability of the model in an open source package. For example, all winning solutions used a “longitude” feature in their models, which captured some underlying differences in sampling procedures by the 14 data providers for the competition. For example, data-providing organizations in California only conduct toxin analysis for suspected blooms, leading to an over-representation of high density samples among competition data points in California. Predicting high severity for all points in California served well in the competition setting, but would not generalize to the real world. As a result, geographic features like longitude, state, and region were not used for the deployed CyFi model.
Competitions can also surface data quality issues. A number of competition winners pointed out that upon inspection of satellite imagery, some competition data points appeared to be outside of any water body. We believe that the small amount of noise in the competition dataset was caused by a combination of human error, GPS device error, and a lack of adequate precision in recorded latitude and longitude.[4]
While it is important to remove points that have erroneous GPS coordinates, it is also the case that sampling point locations are often recorded from a dock or parking lot near where the water sample was taken. In these cases, the bounding box around the sampling point used to generate features would still pick up on relevant water-based characteristics. Filtering out samples that are far from any water body, and keeping points that are on land but near water pixels, is the best method to separate relevant data from incorrect coordinates.
The distance between each sample and the nearest water body was calculated using the European Space Agency (ESA) WorldCover 10m 2021 product on Google Earth Engine. Samples farther than 550m from a water body were excluded to help ensure that the relevant water body fell within the portion of the satellite image from which features were calculated. The WorldCover dataset was chosen over Sentinel-2’s scene classification band as the water classification appeared to be more reliable based on visual review of samples.
4.2.2Satellite feature engineering decisions
Table 4:Satellite feature engineering decisions from model experimentation
| Decision | Explanation |
|---|---|
| Filter to water area and use a large bounding box | Land pixels are filtered out because they are usually greener than water areas, and can generate falsely high cyanobacteria estimates. Sentinel-2's scene classification band is not perfectly accurate, but is sufficient for masking non-water pixels. Since ground sampling points are often on land but near water (taken from the shore or the dock), a large bounding box of 2,000m is used to ensure that relevant water pixels are included. |
| Use a large look-back window and filter to images with almost no clouds | When selecting relevant imagery, CyFi uses Sentinel-2's scene classification band to calculate the percent of clouds in the bounding box. Any imagery that has greater than 5% clouds is not used. CyFi combines a relatively large look-back window of 30 days before the sample with this strict cloud threshold to increase the chances of finding a cloud-free image. |
| Use only one image per sample point | Some winning solutions averaged predictions over multiple satellite images within a specified range. We find that this favors static blooms. We use only the most recent cloud-free image to better detect short-lived blooms. |
4.2.3Target variable decisions
Table 5:Target variable decisions from model experimentation
| Decision | Explanation |
|---|---|
| Estimate density instead of severity | We learned during user interviews that states use different thresholds for action, so predicting density instead of severity categories supports a broader range of use cases. The winning competition models were trained to predict severity. During experimentation, we validated that there was sufficient signal to predict at the higher granularity of exact density. |
| Train the model to predict log density | We find transforming density into a log scale for model training and prediction yields better accuracy, as the underlying data is highly skewed. About 75% of samples have a density less than 400,000 cell/mL, but there are extreme densities into the tens of millions cells/mL. A log scale helps the model learn that incorrectly estimating a density of 100,000 when the true density is 0 is much more important than incorrectly estimating a density of 1,100,000 when the true density is 1,000,000. The estimate a user sees has been converted back into (non-log) density. |
4.3User interview takeaways
Technical experimentation alone is insufficient to build a tool that effectively addresses a real-world problem. Understanding user needs and day-to-day processes helps enable integration with existing workflows and increases the likelihood of adoption. The table below synthesizes key insights gleaned from user interviews, and outlines how each insight supported the development of a user-friendly package.
Table 6:CyFi design decisions rooted in HCD interviews
| Interview insight | CyFi design decision |
|---|---|
| States tend to have designated sampling locations or locations of reported blooms. Coverage of the full area of a water body is nice but not necessary. | CyFi will expect sampling points as input rather than polygons, and the output will be point-estimates rather than a gridded heatmap. |
| Thresholds are not universal and actions vary by state. | Prediction will be a density value rather than severity category. |
| While blooms in small water bodies can change quickly, the maximum cyanobacteria estimation cadence is daily. | A sampling point will be a unique combination of date, latitude, and longitude. Additional time granularity is not needed. |
| Many states include a visual review of imagery (satellite or submitted photo) as part of the decision-making process. | CyFi will include a way to see the underlying satellite data for a given prediction point, to help users build confidence and intuition around the CyFi model. |
| States have their own tools for managing water quality data (e.g. ground samples and lab results). | CyFi will output a simple CSV file that includes identifying columns for joining with external data. |
4.4CyFi
The culmination of the machine learning competition, subsequent model experimentation, and user interviews is CyFi. CyFi, short for Cyanobacteria Finder, is an open-source Python package that uses satellite imagery and machine learning to detect cyanobacteria levels, one type of HAB. CyFi can help decision makers protect the public by flagging the highest-risk areas in lakes, reservoirs, and rivers quickly and easily. CyFi incorporates open-source best practices, including tests and continuous integration, and is ready for use in state-level dashboards and decision-making processes.
4.4.1Data sources
CyFi relies on two data sources as input:
- Sentinel-2 satellite imagery
- Land cover classifications
Sentinel-2 is a wide-swath, high-resolution, multi-spectral imaging mission. The Sentinel-2 Multispectral Instrument (MSI) samples 13 spectral bands: four bands at 10 meters, six bands at 20 meters, and three bands at 60 meters spatial resolution. The mission provides global coverage of the Earth’s land surface every 5 days. Sentinel-2 data is accessed through Microsoft’s Planetary Computer.
CyFi uses high-resolution Sentinel-2 satellite imagery (10-30m) to focus on smaller water bodies with rapidly changing blooms. This is a significant improvement in resolution over Sentinel-3, which is used by most existing satellite-based cyanobacteria detection tools and has a resolution of 300-500m.
The Climate Research Data Package Land Cover Gridded Map (2020) categorizes land surface into 22 classes, which have been defined using the United Nations Food and Agriculture Organization’s Land Cover Classification System (LCCS). The map is based on data from the Medium Resolution Imaging Spectrometer (MERIS) sensor on board the polar-orbiting Envisat-1 environmental research satellite by the European Space Agency. CyFi accesses the data using the CCI-LC database hosted by the ESA Climate Change Initiative’s Land Cover project.
4.4.2Feature processing
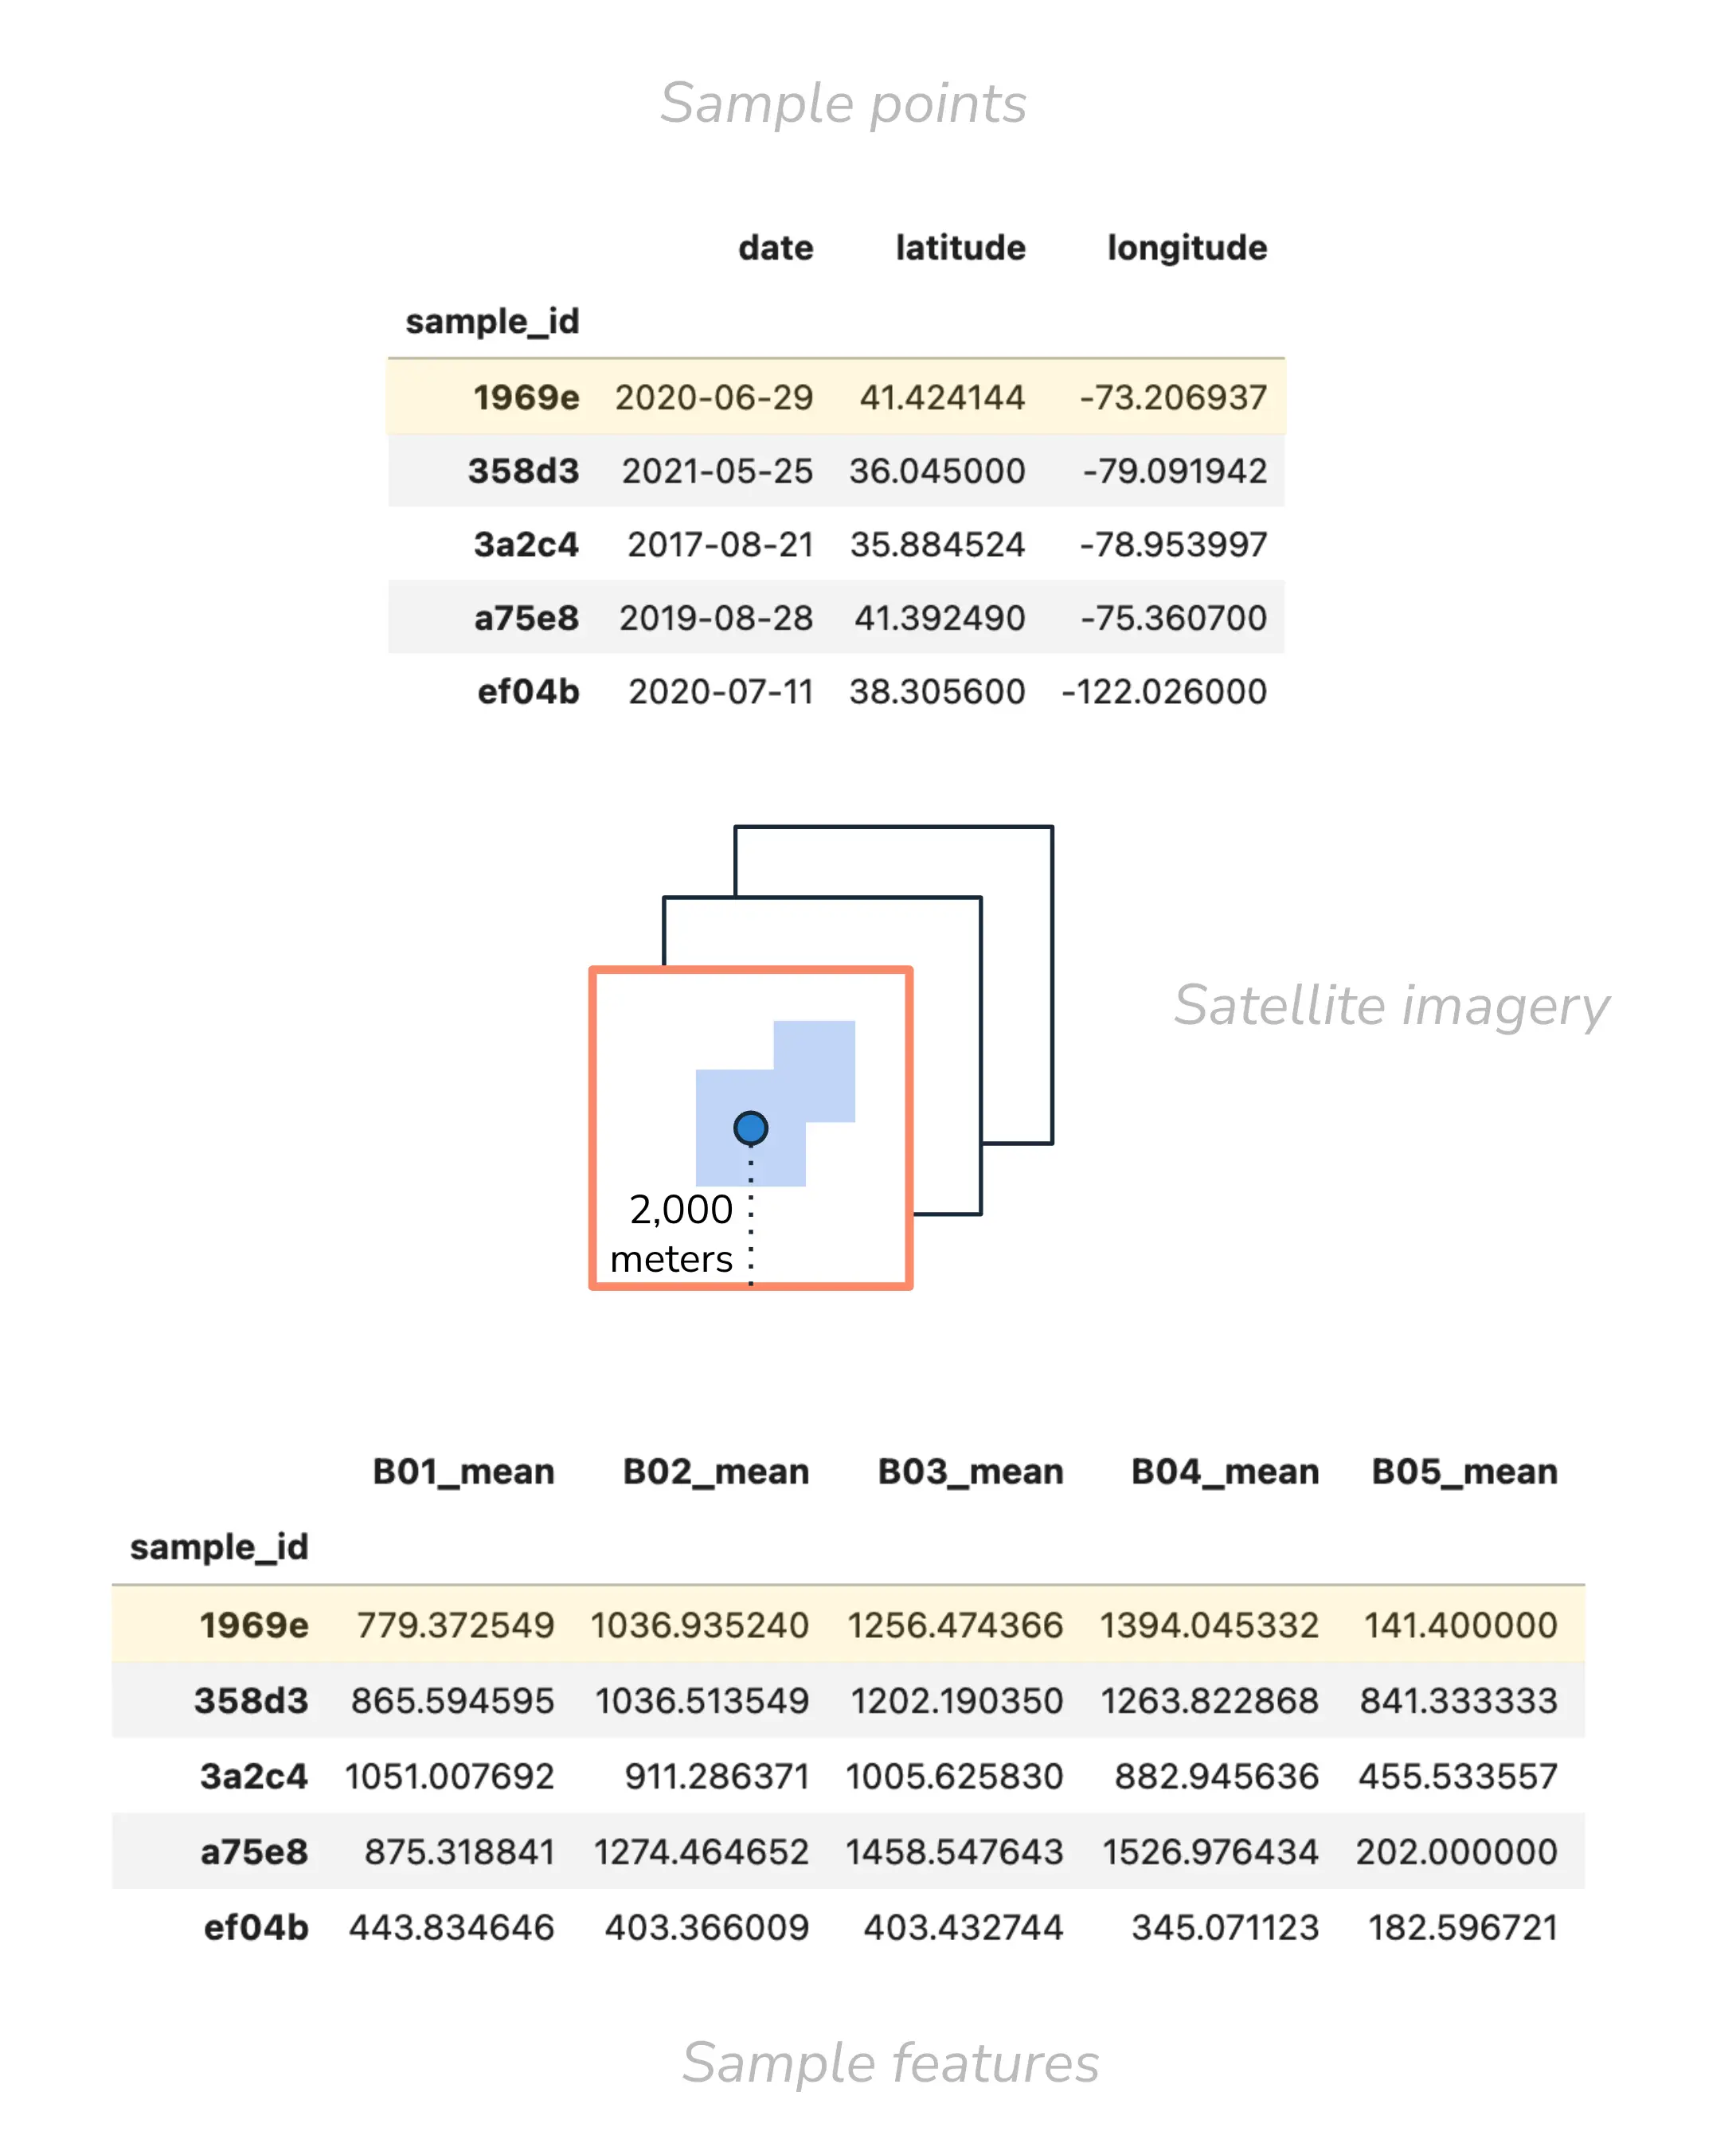
Figure 5:Mock up of satellite data selection and processing. The dot represents the sample point; the square represents the 2,000m bounding box around the sample point. The multiple squares outlined in black represents the multiple satellite image contenders within the lookback period. The orange outlined square indicates the selected, most-recent satellite image. The blue shaded area indicates the water pixels in the bounding box from which features are calculated.
Note that not all features are represented in the columns. The table above shows a few features calculated based on the B01 (aerosol), B02 (blue), B03 (green), B04 (red), and B05 (red edge) Sentinel-2 bands.
Each observation (or “sampling point”) is a unique combination of date, latitude, and longitude. Feature generation for each observation is as follows:
- Download up to 15 relevant Sentinel-2 tiles based on a bounding box of 2,000m around the sampling point and a time range of 30 days prior to (and including) the sampling date.
- Select the most recent image that has a bounding box containing less than 5% cloud pixels. If none of the images meet this criteria, no prediction is made for that sampling point.
- Filter the pixels in the bounding box to the water area using the scene classification (SCL) band.
- Generate band summary statistics (e.g., mean, 95th percentile) and ratios (e.g, green-blue ratio, NDVI) using 15 different Sentinel-2 bands. The full list of satellite image features is here: cyfi/config.py
- Calculate two satellite metadata features: 1) the month of selected satellite image and 2) the number of days between the sampling date and the satellite image capture.
- Look up static land cover map data for the sampling point, and combine land cover information with satellite features.
4.4.3Model
Cyanobacteria estimates are generated by a gradient-boosted decision tree algorithm built with LightGBM Ke et al., 2017. The hyperparameters can be found here: cyfi/config.py.
The model was trained and evaluated using “in situ” labels collected manually by many organizations across the U.S. The train-test split was maintained from the competition data, with additional filtering to remove samples prior to the launch of Sentinel-2 or more than 550m from a water body.
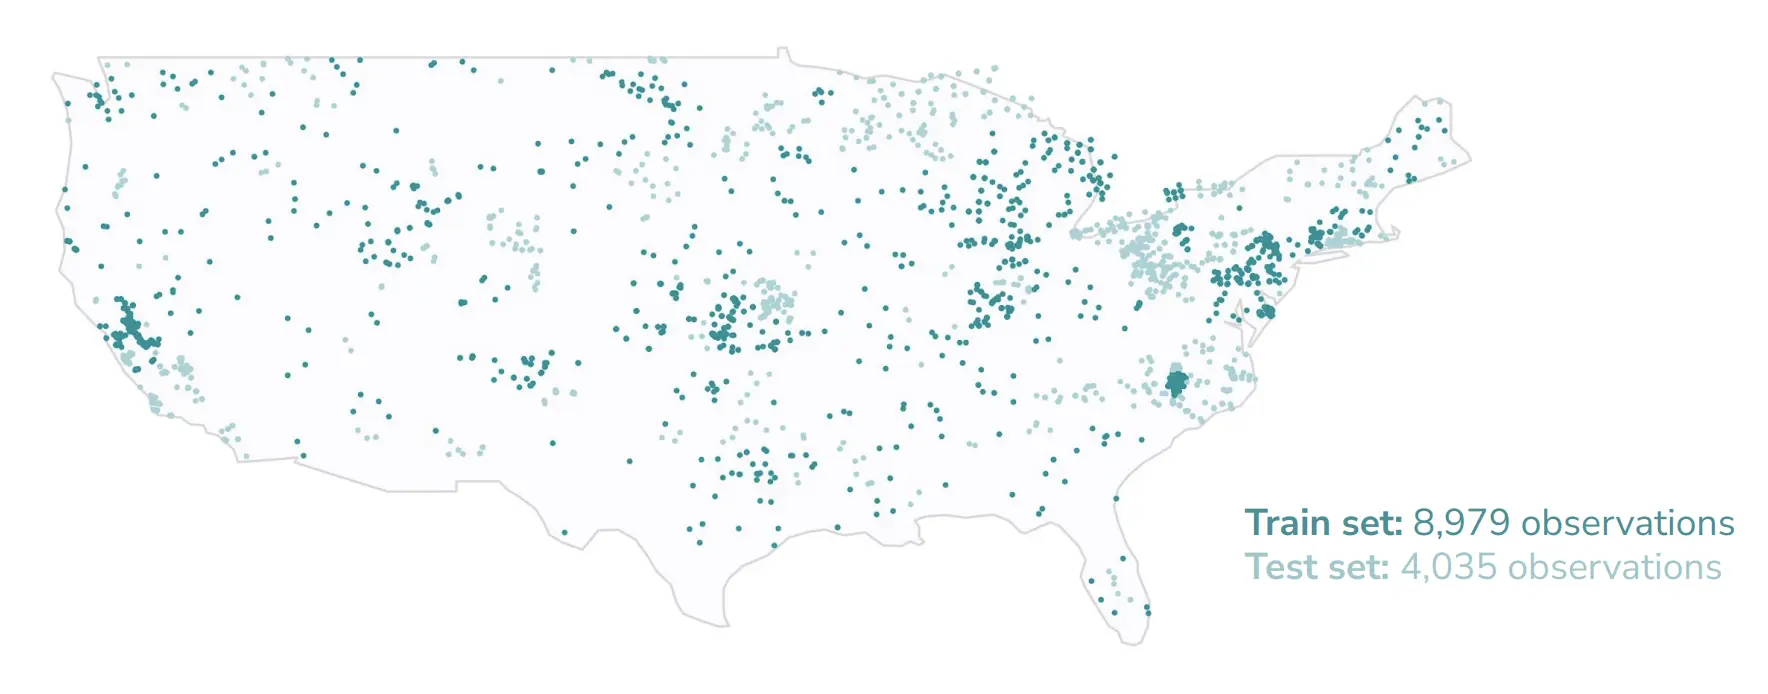
Figure 6:Location and distribution of training and evaluation data for CyFi.
CyFi was ultimately trained on 5,721 of the 8,979 train set observations due to satellite imagery availability.[5]
4.4.4Performance
CyFi was evaluated using 2,880 ground measurements from 12 data providers spanning the time range August 2015 to December 2021.[6] Given that CyFi relies on Sentinel-2 imagery, the earliest date in the evaluation set aligns with the launch of Sentinel-2 (mid 2015). Of these points, 1,153 were low severity, 504 were moderate severity, and 1,223 were high severity according to ground measurement data. Some states only conduct toxin analysis when blooms are suspected, which may account for the large number of high-severity observations in the evaluation set.
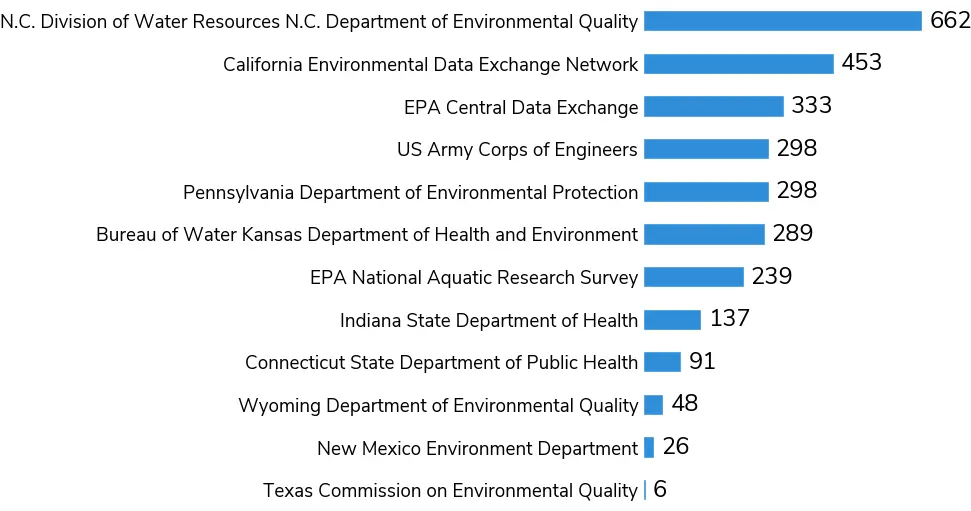
Figure 7:Counts of cyanobacteria measurements by data provider in the evaluation set.
We use the following categories based on World Health Organization (2003) for evaluation:
- Non-bloom: Cyanobacteria density is less than 20,000 cells/mL
- Bloom: Cyanobacteria density is at least 20,000 cells/mL
- Severe bloom: Cyanobacteria density is greater than 100,000 cells/mL. Severe blooms are a subset of blooms
On this evaluation dataset, CyFi detects 48% of non-blooms with 63% precision. Being able to detect places not likely to contain blooms enables ground sampling staff to de-prioritize low-risk sampled locations and better allocate limited resources.
CyFi detects 81% of blooms with 70% precision. Based on user interviews, moderate blooms are important to identify because they should be prioritized for sampling. There may be negative public health impacts and more precise toxin analysis is needed.
Lastly, CyFi detect 53% of severe blooms with 71% precision. These locations pose the highest risk of severe negative health impacts, and are critical to flag for decision makers to prioritize for public health action (e.g., issuing advisories). In the most severe cases, additional visual inspection of the satellite imagery used by CyFi may be sufficient to issue an advisory without additional sampling. CyFi enables this step with its CyFi Explorer functionality.
Model accuracy can vary based on bloom severity as well as location and other attributes of the sampling point, so the performance metrics above will vary based on the distribution in the evaluation set. After concluding the model experimentation phase, we conducted a small out-of-sample evaluation using new data collected by California during summer 2023 (231 total observations). We found that estimated cyanobacteria densities increased with the severity of the advisory level that was issued. While the relative ordering of points based on estimated severity was promising, absolute cyanobacteria densities were consistently overestimated. This reinforces that the main immediate use case of CyFi is to identify comparatively higher and lower priority areas, and to inform rather than replace ground sampling activities.
Table 7:CyFi estimates compared to ground truth advisory level for out-of-sample California data from 2023
| Ground truth advisory level | Median predicted cyanobacteria density |
|---|---|
| No bloom | 92,560 cells/mL |
| Caution | 206,923 cells/mL |
| Warning / Danger | 295,558 cells/mL |
This table shows the promise of CyFi in relative ordering of points by severity level as well as the limitations of absolute predicted values. Predicted density correctly increases with the severity of the advisory level, although absolute density is generally overestimated. For example, the expected density range is 0-20,000 cells/mL for "No bloom" and 20,000-100,000 cells/mL for "Caution" based on World Health Organization guidelines. California data in the training set was heavily biased toward severe blooms due to California's sampling protocols, likely driving this overestimation. A promising mitigation strategy is the inclusion of more true negative points from California in the training data.
4.4.5Benchmark comparison
An apples-to-apples comparison with one of the leading tools for cyanobacteria estimation from satellite imagery is provided as a more objective benchmark of performance. The Cyanobacteria Index was developed through the Cyanobacteria Assessment Network (CyAN). It is based on a spectral shape algorithm that relates to chlorophyll absorption, initially using Sentinel-3’s MERIS and now using OLCI Urquhart et al., 2017Wynne et al., 2010Mishra et al., 2019Wynne et al., 2008.
Due to lower resolution of satellite imagery as well as missing data, CyAN’s Cyanobacteria Index is only able to provide estimates for 30% of points in the evaluation set described in Figure 7 (756 points). A major advantage of CyFi is coverage of small water bodies. Over half of the points in the evaluation set were identified as “land” by CyAN due to the coarse resolution of Sentinel-3 imagery. An additional 18% of points had “no data” likely due to clouds or bad imagery.
Among the portion of the evaluation set captured by CyAN, CyFi detects blooms with slightly higher accuracy. Using a cutoff of 10,000 cells/mL per Mishra et al. (2021), we find CyFi has a presence/absence accuracy of 72% compared to 66% for CyAN. The improved accuracy is largely due to a higher correct classification of true positive cases (blooms).
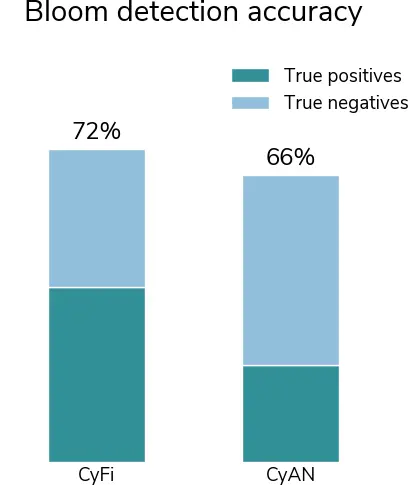
Figure 8:A comparison of CyFi and CyAN model accuracy on 756 ground sampled data points from across the U.S. A true positive (bloom presence) is where cyanobacteria density > 10,000 cells/mL.
CyFi correctly identifies 306 of 389 blooms, while CyAN correctly identifies 169 (true positives). CyFi correctly identifies 241 of 367 non-blooms, while CyAN correctly identifies 332 (true negatives).
This performance shows that CyFi offers similar accuracy as a leading tool but at 10m resolution instead of 300m. This dramatic increase in spatial granularity enables remote sensing-based bloom detection in small, inland water bodies across the U.S.
4.4.6Using CyFi
Comprehensive instructions for using CyFi can be found in the CyFi docs. The below provides an overview of some of CyFi’s key functionality.
CyFi is designed to be simple to use. To get started, users can install CyFi with pip.[7]
$ pip install cyfiCyanobacteria predictions can then be generated with a single command. The only information needed to generate a prediction is a location (latitude and longitude) and date.
$ cyfi predict-point --lat 35.6 --lon -78.7 --date 2023-09-25

SUCCESS  | Estimate generated:
date                    2023-09-25
latitude                      35.6
longitude                    -78.7
density_cells_per_ml        22,836
severity                  moderate
For each sampling point, CyFi downloads recent cloud-free Sentinel-2 data from Microsoft’s Planetary Computer, calculates a set of summary statistics using the spectral bands for the portion of the image around the sampling point, and passes those features to a LightGBM model which produces an estimated cyanobacteria density.
CyFi also makes it easy to generate cyanobacteria estimates for many points at once. Users can input a CSV with columns for date, latitude, and longitude.
Table 8:Example input csv (samples.csv) containing the sampling points where cyanobacteria estimates are needed
| latitude | longitude | date |
|---|---|---|
| 41.424144 | -73.206937 | 2023-06-22 |
| 36.045 | -79.0919415 | 2023-07-01 |
| 35.884524 | -78.953997 | 2023-08-04 |
A CSV input can also be processed with a single command.
$ cyfi predict samples.csv

SUCCESS  | Loaded 3 sample points (unique combinations of date, latitude, and longitude) for prediction
SUCCESS  | Downloaded satellite imagery
SUCCESS  | Cyanobacteria estimates for 4 sample points saved to preds.csv
Cyanobacteria estimates are saved out as a CSV that can be plugged into any existing decision-making process. For each point, the model provides an estimated density in cells per mL for detailed analysis. Densities are also discretized into severity levels based on World Health Organization guidelines World Health Organization, 2003.
Table 9:CyFi outputted csv (preds.csv) containing predictions
| sample_id | date | latitude | longitude | density_cells_per_ml | severity |
|---|---|---|---|---|---|
| 7ff4b4a56965d80f6aa501cc25aa1883 | 2023-06-22 | 41.424144 | -73.206937 | 34,173 | moderate |
| 882b9804a3e28d8805f98432a1a9d9af | 2023-07-01 | 36.045 | -79.0919415 | 7,701 | low |
| 10468e709dcb6133d19a230419efbb24 | 2023-08-04 | 35.884524 | -78.953997 | 4,053 | low |
Table 10:WHO Recreational Guidance/Action Levels for Cyanobacteria World Health Organization, 2003
| Relative Probability of Acute Health Effects | Cyanobacteria (cells/mL) |
|---|---|
| Low | < 20,000 |
| Moderate | 20,000–100,000 |
| High | >100,000–10,000,000 |
| Very High | > 10,000,000 |
4.4.7CyFi Explorer
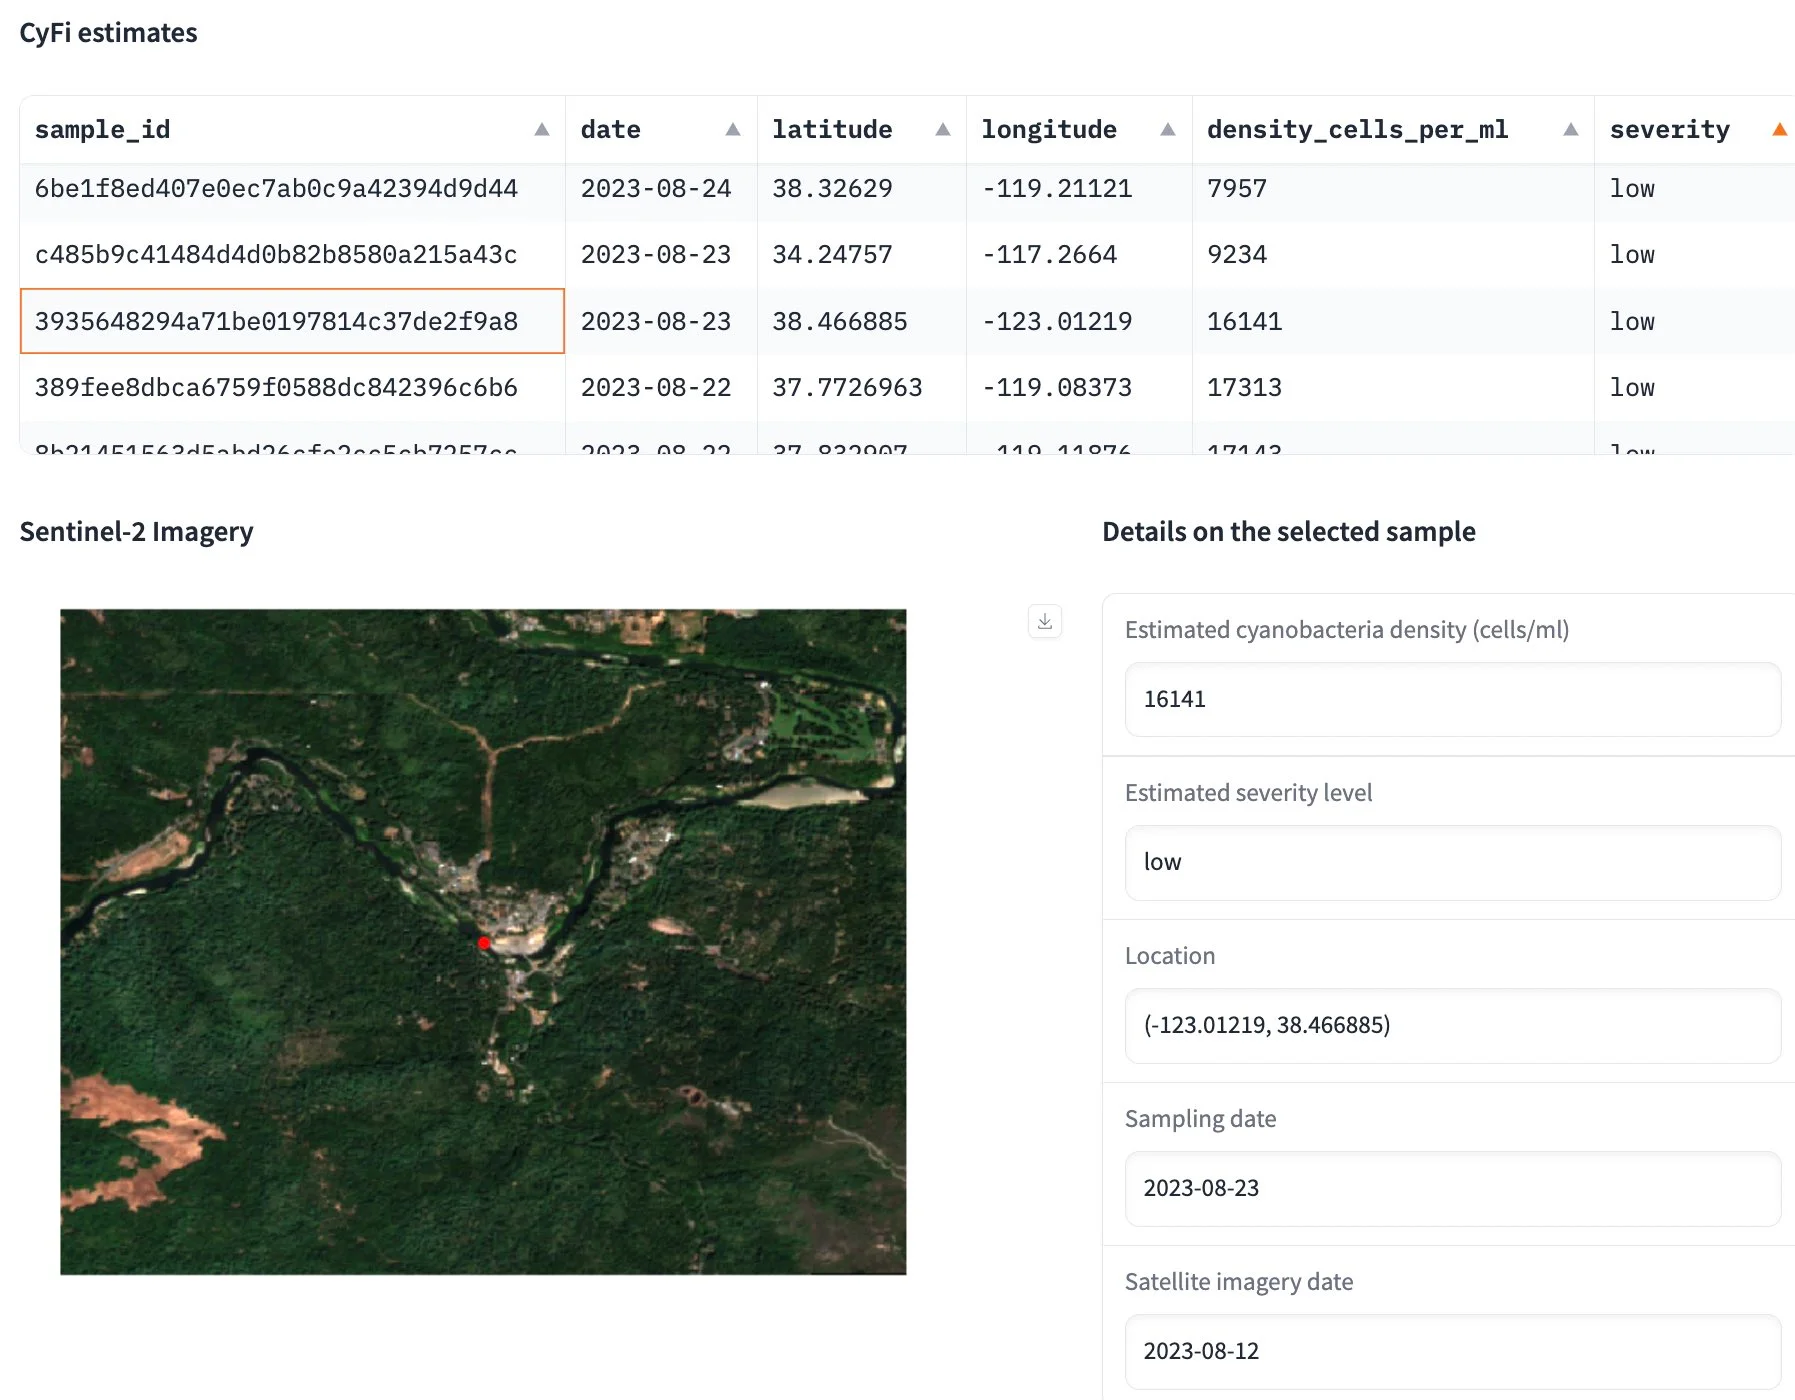
Figure 9:Screenshot of CyFi Explorer, a visualization tool that surfaces the underlying satellite imagery used to generate the cyanobacteria estimate.
CyFi also comes with a visualization tool called CyFi Explorer. CyFi Explorer surfaces the corresponding Sentinel-2 imagery for each cyanobacteria estimate. The explorer runs a Gradio app locally on the user’s machine and is intended to enable visual inspection of where the model is performing well, as well as edge cases or failure modes. It is not intended to replace more robust data analytics tools and decision-making workflows.
5Discussion
CyFi’s progression from a machine learning competition that surfaced promising approaches, through subsequent user interviews and model iteration, to a deployment-ready open source package illustrates a replicable pathway for developing powerful machine learning tools in domain-specific areas.
We find that CyFi performs at least as well as a leading Sentinel-3 based tool, but has significantly greater coverage of water bodies across the U.S. due to the higher resolution of Sentinel-2 data. This dramatically expands the applicability of remote sensing-based estimates as a tool for management of HABs.
5.0.1Implications for use
CyFi works best as an enhancement to existing decision-making processes through its ability to surface high and low priority areas. At its current accuracy level, we believe CyFi should be used to inform human workflows rather than triggering automatic actions.
Based on discussions with end users, a few common use cases for CyFi are listed below. Overall, CyFi supports more widespread and timely public health actions, better allocation of ground sampling resources, and more informed impairment and regulatory monitoring.
- Flag high severity blooms for public health action
High concentrations of cyanobacteria often merit public health interventions. Having daily estimates at designated sampling points can quickly and easily surface worrisome conditions. States have the flexibility to design their own processes for how to use this information. For example, some states may choose to prioritize these locations for ground sampling where advisory levels are dependent upon toxin analysis results. Other states may choose to take action such as issuing a press release based on visual review of imagery alone.
- Identify locations where ground sampling can be deprioritized
Identifying water bodies that are not experiencing blooms can be just as helpful as identifying water bodies that are. Ground sampling is time and labor intensive, and CyFi enables water quality managers to deprioritize sampling in the areas least likely to contain blooms.
- Confirm publicly reported blooms with more data
Multiple states rely on visual inspection of a submitted photo to confirm a bloom. CyFi can both generate a cyanobacteria density estimate and show the most recent, cloud free 10m satellite imagery for that location.
- Provide a birds-eye view of lake conditions across the state
Many states track impaired and threatened waters in accordance with the Clean Water Act and develop total maximum daily loads (TMDLs), which specify the maximum amount of pollutant allowed to enter a water body. Routine predictions from CyFi can help monitor the progression in water bodies where cyanobacteria is a primary concern.
5.0.2Future directions
While CyFi represents a significant step forward in detecting cyanobacteria from satellite imagery, challenges remain. CyFi is the least reliable for the following cases:
- In very narrow or small waterways
- When there are clouds obscuring the area around a sampling point
- Where multiple water bodies are nearby in the same satellite image
Model performance could be improved by retraining with additional ground measurements for true negative cases, adding water body segmentation to exclude pixels from non-contiguous water bodies, and adding cloud segmentation to remove cloud pixels from feature calculations. Additionally, incorporating more sophisticated time-series climate features may enhance model accuracy. To support users who desire comprehensive estimates across an entire water body, a pre-processing step could be added that accepts a water body polygon as input and transforms this into a grid of sample points.
As decision-makers begin experimenting with CyFi, we recommend calculating historical estimates and comparing these against prior ground measurements to get a baseline accuracy for CyFi’s performance. Using CyFi Explorer to review predictions can provide further insight into water bodies that may be particularly challenging for CyFi.
6Conclusion
CyFi is a powerful tool for identifying high and low levels of cyanobacteria, and enables humans to make more timely and targeted decisions when issuing public health guidance around current cyanobacteria levels. Areas with low-density cyanobacteria counts can be excluded from ground sampling to better prioritize limited resources, while areas with high-density cyanobacteria counts can be prioritized for public health action. The development of CyFi illustrates the utility of machine learning competitions as a first step toward open source tools. CyFi’s primary use cases show how machine learning can be incorporated into human workflows to enable more efficient and more informed decision making.
Acknowledgments
This project was supported by funding from National Aeronautics and Space Administration Science Mission Directorate’s Earth Science, Applied Sciences, Health and Air Quality, and the NASA Prizes, Challenges, and Crowdsourcing Programs. The project was led by DrivenData and managed by the NASA Tournament Lab, part of the Prizes, Challenges, and Crowdsourcing Program in NASA’s Space Technology Mission Directorate for the NASA Open Innovation Services 2 (NOIS2) contract 80JSC020D0041.
The authors express their gratitude to collaborators, advisors, and data providers at the following organizations, whose support made this study possible: National Oceanic and Atmospheric Administration, Environmental Protection Agency, Alaska Department of Environmental Conservation, Arizona Department of Environmental Quality, Bureau of Water Kansas Department of Health and Environment, California Environmental Data Exchange Network, Centers for Disease Control and Prevention, Connecticut State Department of Public Health, Delaware National Resources and the University of Delaware’s Citizen Monitoring Program, EPA Central Data Exchange, EPA National Aquatic Research Survey, EPA Ohio, EPA Water Quality Data Portal, Indiana State Department of Health, Iowa Department of Natural Resources, Louisiana Department of Environmental Quality, Maine Bureau of Water Quality - Division of Environmental Assessment, N.C. Division of Water Resources N.C. Department of Environmental Quality, New Jersey Department of Environmental Protection, New Mexico Environment Department, New York State Department of Environmental Protection, North Dakota Department of Environmental Quality, Pennsylvania Department of Environmental Protection, Rhode Island Department of Environmental Management - Office of Water Resources, South Carolina Department of Health and Environmental Control, State of Georgia - Environmental Protection Division, State of Michigan - Lake Michigan Unit - Surface Water Assessment Section - Water Resources Division - Department of Environment Great Lakes and Energy, Tennessee Department of Environment and Conservation, Texas Commission on Environmental Quality, UMRBA (Upper Mississippi River Basin Association), U.S. Army Corps of Engineers, USGS Water Quality Data Portal - Harmful Algal Bloom Science in Texas, Utah Department of Environmental Quality - Division of Water Quality, Vermont Department of Health - Health and the Environment, Virginia Department of Health, West Virginia Department of Environmental Protection, Wisconsin Department of Natural Resources, Wyoming Department of Environmental Quality. The authors would like to thank Yang Xu, Andrew Wheeler, and Raphael Kimina, the Tick Tick Bloom competition winners whose modeling approaches provided the foundation for CyFi. The authors also thank the reviewers who provided constructive comments and suggestions to improve the quality of the manuscript.
Correspondence regarding the CyFi Python package should be directed to Emily Dorne at emily@drivendata
The authors would like to thank Yang Xu, Andrew Wheeler, and Raphael Kimina, the Tick Tick Bloom competition winners whose modeling approaches provided the foundation for CyFi.
The success of decision tree models in the Tick Tick Bloom competition is consistent with other DrivenData competitions where the task was point-based prediction from satellite imagery (i.e., estimating the amount of water in snowpack and estimating levels of air pollution).
At the equator, a longitude value to 2 decimal degrees is only accurate to around a 1km distance Decimal degrees, 2024.
CyFi did not use the remaining 3,258 points in the train set due to a lack of valid satellite data. In order to generate features, there must be at least one satellite image within 30 days prior to the sampling date where cloud pixels account for less than 5% of the pixels in the bounding box around the sampling point.
CyFi did not produce cyanobacteria estimates for the remaining 1,155 points in the test set due to a lack of valid satellite data. In order to produce an estimate, there must be at least one satellite image within 30 days prior to the sampling date where cloud pixels account for less than 5% of the pixels in the bounding box around the sampling point.
Alternatively, CyFi can be installed with conda (
conda install -c conda-forge cyfi), which is recommended for M1 Mac users as of July 2024 due to a known issue with the pip installation of LightGBM.
- CDC. (n.d.). Harmful Algal Bloom (HAB)-Associated Illness. https://www.cdc.gov/harmful-algal-blooms/about/index.html
- Papenfus, M., Schaeffer, B., Pollard, A. I., & Loftin, K. (2020). Exploring the potential value of satellite remote sensing to monitor chlorophyll-a for US lakes and reservoirs. Environmental Monitoring and Assessment, 192(12). 10.1007/s10661-020-08631-5
- DrivenData. (2024). CyFi: Cyanobacteria Finder. https://cyfi.drivendata.org/
- Pulido, O. M. (2016). Phycotoxins by Harmful Algal Blooms (HABS) and Human Poisoning: An Overview. International Clinical Pathology Journal, 2(6). 10.15406/icpjl.2016.02.00062
- Treuer, G., Kirchhoff, C., Lemos, M. C., & McGrath, F. (2021). Challenges of managing harmful algal blooms in US drinking water systems. Nature Sustainability, 4(11), 958–964. 10.1038/s41893-021-00770-y
- Lad, A., Breidenbach, J. D., Su, R. C., Murray, J., Kuang, R., Mascarenhas, A., Najjar, J., Patel, S., Hegde, P., Youssef, M., Breuler, J., Kleinhenz, A. L., Ault, A. P., Westrick, J. A., Modyanov, N. N., Kennedy, D. J., & Haller, S. T. (2022). As We Drink and Breathe: Adverse Health Effects of Microcystins and Other Harmful Algal Bloom Toxins in the Liver, Gut, Lungs and Beyond. Life, 12(3), 418. 10.3390/life12030418
- Watson, S. B., Miller, C., Arhonditsis, G., Boyer, G. L., Carmichael, W., Charlton, M. N., Confesor, R., Depew, D. C., Höök, T. O., Ludsin, S. A., Matisoff, G., McElmurry, S. P., Murray, M. W., Peter Richards, R., Rao, Y. R., Steffen, M. M., & Wilhelm, S. W. (2016). The re-eutrophication of Lake Erie: Harmful algal blooms and hypoxia. Harmful Algae, 56, 44–66. 10.1016/j.hal.2016.04.010
- Hoagland, P., Jin, D., Polansky, L. Y., Kirkpatrick, B., Kirkpatrick, G., Fleming, L. E., Reich, A., Watkins, S. M., Ullmann, S. G., & Backer, L. C. (2009). The Costs of Respiratory Illnesses Arising from Florida Gulf Coast Karenia brevis Blooms. Environmental Health Perspectives, 117(8), 1239–1243. 10.1289/ehp.0900645
- Hoagland, P., Anderson, D. M., Kaoru, Y., & White, A. W. (2002). The economic effects of harmful algal blooms in the United States: Estimates, assessment issues, and information needs. Estuaries, 25(4), 819–837. 10.1007/bf02804908
- Khan, R. M., Salehi, B., Mahdianpari, M., Mohammadimanesh, F., Mountrakis, G., & Quackenbush, L. J. (2021). A Meta-Analysis on Harmful Algal Bloom (HAB) Detection and Monitoring: A Remote Sensing Perspective. Remote Sensing, 13(21), 4347. 10.3390/rs13214347
- Clark, J. M., Schaeffer, B. A., Darling, J. A., Urquhart, E. A., Johnston, J. M., Ignatius, A. R., Myer, M. H., Loftin, K. A., Werdell, P. J., & Stumpf, R. P. (2017). Satellite monitoring of cyanobacterial harmful algal bloom frequency in recreational waters and drinking water sources. Ecological Indicators, 80, 84–95. 10.1016/j.ecolind.2017.04.046
- Ohio Environmental Protection Agency. (2022). Developing a Harmful Algal Bloom (HAB) Treatment Optimization Protocol. https://dam.assets.ohio.gov/image/upload/epa.ohio.gov/Portals/28/documents/habs/TreatmentOptimizationProtocol.pdf
- United States Environmental Protection Agency. (2024). Climate Change and Freshwater Harmful Algal Blooms. https://www.epa.gov/habs/climate-change-and-freshwater-harmful-algal-blooms
- DrivenData. (2023). Tick Tick Bloom: Harmful Algal Bloom Detection Challenge: Results. https://www.drivendata.org/competitions/143/tick-tick-bloom/
- Bull, P., Slavitt, I., & Lipstein, G. (2016). Harnessing the Power of the Crowd to Increase Capacity for Data Science in the Social Sector. arXiv. 10.48550/ARXIV.1606.07781