
Supporting Greater Interactivity in the IPython Visualization Ecosystem
Abstract
Interactive visualizations are invaluable tools for building intuition and supporting rapid exploration of datasets and models. Numerous libraries in Python support interactivity, and workflows that combine Jupyter and IPyWidgets in particular make it straightforward to build data analysis tools on the fly. However, the field is missing the ability to arbitrarily overlay widgets and plots on top of others to support more flexible details-on-demand techniques. This work discusses some limitations of the base IPyWidgets library, explains the benefits of IPyVuetify and how it addresses these limitations, and finally presents a new open-source solution that builds on IPyVuetify to provide easily integrated widget overlays in Jupyter.
1Introduction
As the tech industry and computation-based research continues to gravitate toward using more and more data to solve problems, the capability to interact with and understand that underlying data becomes increasingly important. Development of effective visualization tools and frameworks to address this need has turned into an ecosystem where components from different sources all work in unison and developers can piece together what they need for their specific goals. For many reasons, including the ease of organization and allowing documentation, development, and analysis to all exist in the same place, Jupyter notebooks Kluyver et al., 2016 have become a common platform for data science workflows, and by extension have become the common ground where these different tools can coexist. An important piece to this platform is the ability to interact with and visualize data, which is crucial in many data science/analysis workflows. Interactive visualization allows users to manipulate and explore data, which enhances understanding, improves engagement, and often leads to a quicker intuitive grasp of the data.
IPyWidgets Jupyter Widgets, 2015, a framework for bridging between the IPython kernel and HTML widgets within Jupyter, has been particularly influential for enabling interactive visualization. Many libraries such as Panel Philipp Rudiger et al., 2024 and Solara Breddels, 2022 integrate closely with IPyWidgets and thus contribute to the greater visualization ecosystem within Python. Although a great deal of progress has been made in this community, a missing element is a more generalized and flexible approach to aspects of the details-on-demand paradigm. To support this approach, the authors have developed a library that provides wrapper components that can render any widget as an overlay on top of other widgets. These components simplify designing layouts and visualizations that would be difficult to implement from scratch.
In this work, we first discuss IPyWidgets and what makes it such an important piece of the overall system, as well as some of the limitations encountered when building only with the base IPyWidgets framework. We then briefly cover some of the available libraries that build on top of IPyWidgets, highlighting IPyVuetify, which addresses most of the limitations of base IPyWidgets. Finally, we discuss a library we have open sourced called IPyOverlay and an example use case that motivated its design.
1.1Details on Demand
Details on demand is one piece of the “visual information-seeking mantra” of Schneiderman (1996) describing an overall design approach to building interactive tooling. The general flow of interaction proposed by this mantra is “overview first, zoom and filter, then details-on-demand” Shneiderman, 1996. Overview ideally starts with broader aggregate visualizations: something to gain a sense of the general scope, complexity, or shape of the data. From there a user can identify areas of interest to hone in on with whatever zoom and filter tools are applicable for their data’s modality. Finally, details on demand means that the user can see or interact with more in-depth and specific information for pieces of their data, often in the form of a pop-up window or inset graph. This selective detail capability provides a flexible user experience that keeps the initial interface uncluttered without sacrificing the ability to organically explore the data.
A simple and widespread example of details on demand are tooltips. Descriptions of components or data point values in visualizations would often create an unusably noisy interface if they were always visible. Instead, a more concise view is maintained while providing the necessary information in a spatially relevant view when the user specifically requests it. Readers viewing the web version of these proceedings can explore a simple example of details on demand live by hovering over any of the figure references. Figure 1 shows how hovering over a reference (the demand) opens a window at the cursor that displays the target of the reference (the details).

Figure 1:A figure demonstrating details on demand in action when a user hovers over the figure reference for Figure 1.
2IPyWidgets
IPyWidgets is a library for implementing user interactivity inside of a Jupyter Notebook. A key challenge this framework has to overcome is the separation between the Python kernel and the browser-based Jupyter frontend, which operates through HTML, CSS, and JavaScript as a web application. Web application development is often a challenging software engineering problem in its own right, and many Python developers and scientists may not have either the experience or the desire to write custom frontend code in JavaScript. IPyWidgets addresses this problem by supporting mechanisms for automatic state synchronization between a Python model and a JavaScript model, expanded on below, and providing a set of predefined components that a developer can initialize and use in their Python code. While IPyWidgets has limitations, it is a valuable tool for the scientific Python community by allowing the combination of two language ecosystems with many visualization libraries and capabilities.
To highlight the simplicity of IPyWidgets, some minimal
examples are provided here. In the simplest UI cases, IPyWidgets allows wrapping a
function call that produces a visual output based on some set of input
parameters with ipywidgets.interactive(), which automatically
constructs an appropriate input widget for each parameter. In this case, the
developer need not manually initialize any Python widgets, as seen in the below
code sample Program 1 and Figure 2.
1 2 3 4 5 6 7 8 9 10import matplotlib.pyplot as plt import numpy as np import ipywidgets as ipw def graph(coefficient): x = np.arange(0, 10, .1) y = np.sin(coefficient * x) plt.plot(x, y) ipw.interactive(graph, coefficient=(0.1, 10.1))
Program 1:Minimal IPyWidget usage for a plot of a sine wave based on one parameter/coefficient. The interactive() call turns the passed tuple for coefficient into a slider widget with the range set to this tuple. See Figure 2 for output.
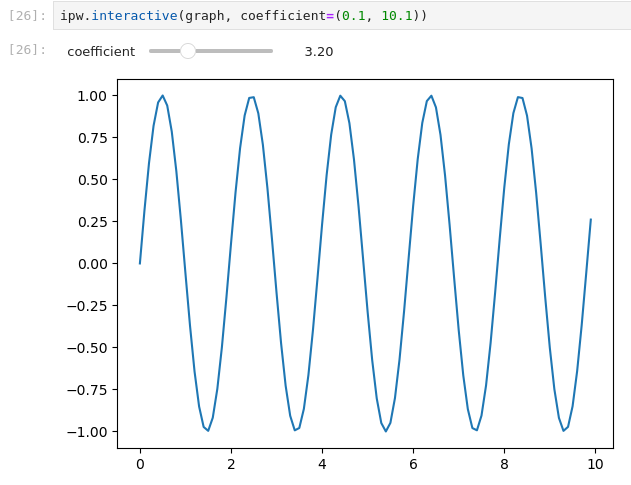
Figure 2:A simple IPyWidgets example using interactive(). Every time the slider is
moved, the graph(coefficient) function is called with the updated value and
regenerates/displays the new plot.
More complex interfaces often require displaying multiple visualizations and
outputs and may have controls that must interact. Thus, in
practice a more common setup might follow a pattern shown in
Program 2, where several user input and output widgets are
defined and placed into a layout widget. UI code is generally event driven, so
functionality is added by attaching event handlers to input widgets with
.observe(), which will then call the associated event functions when the user
interacts with the input widget. IPyWidget’s generic Output widget supports
IPython’s set of display functions, and anything that can be rendered as the
output to a Jupyter cell can be placed into a specified output widget.
1 2 3 4 5 6 7 8 9 10 11 12 13 14 15 16 17 18 19 20 21 22 23 24 25 26 27 28 29 30 31 32 33 34 35 36 37 38import ipywidgets as ipw # initialize the widgets graph1_out = ipw.Output() graph2_out = ipw.Output() graph1_param = ipw.FloatSlider(min=0, max=10, value=1) # a parameter only influencing graph 1 graph2_param = ipw.IntSlider(min=0, max=10, value=1) # a parameter only influencing graph 2 both_graphs_param = ipw.IntText(value=1) # a parameter that affects both graphs # create the dashboard layout, combining all the widgets dashboard = ipw.VBox([ ipw.HBox([graph1_out, graph2_out]), ipw.HBox([graph1_param, both_graphs_param, graph2_param]), ]) # event handler functions def on_graph1_param_change(change): with graph1_out: print(f"Updating graph 1 based on: graph1_param={change['new']}, {both_graphs_param.value=}") def on_graph2_param_change(change): with graph2_out: print(f"Updating graph 2 based on: graph2_param={change['new']}, {both_graphs_param.value=}") def on_both_graphs_param_change(change): with graph1_out: print(f"Updating graph 1 based on: {graph1_param.value=}, both_graphs_param={change['new']}") with graph2_out: print(f"Updating graph 2 based on: {graph2_param.value=}, both_graphs_param={change['new']}") # attach event handlers graph1_param.observe(on_graph1_param_change, names=["value"]) graph2_param.observe(on_graph2_param_change, names=["value"]) both_graphs_param.observe(on_both_graphs_param_change, names=["value"]) # render the dashboard dashboard
Program 2:An example of a more typical structure for a dashboard with several inputs and outputs that might have more complicated interdependencies than can be handled with interactive().
2.1State Synchronization
One of the primary challenges that IPyWidgets helps solve is the problem of state synchronization, where updates to variables made on either side of the Python-JavaScript link are monitored and communicated across when they occur. Based on this communication, changes to variables in Python are reflected in the browser’s JavaScript and vice versa. Under the hood, IPyWidgets makes use of backbone.js Jupyter Widgets, 2024, a model-view-_ (MV_) framework for JavaScript that implements synchronization between a JavaScript model (where data/attributes/values for a widget are stored) and a JavaScript view (the code that creates the visual UI elements the user sees and interacts with in their browser). IPyWidgets connects to this backbone model via WebSockets, through which model changes and events are sent as serialized JSON.
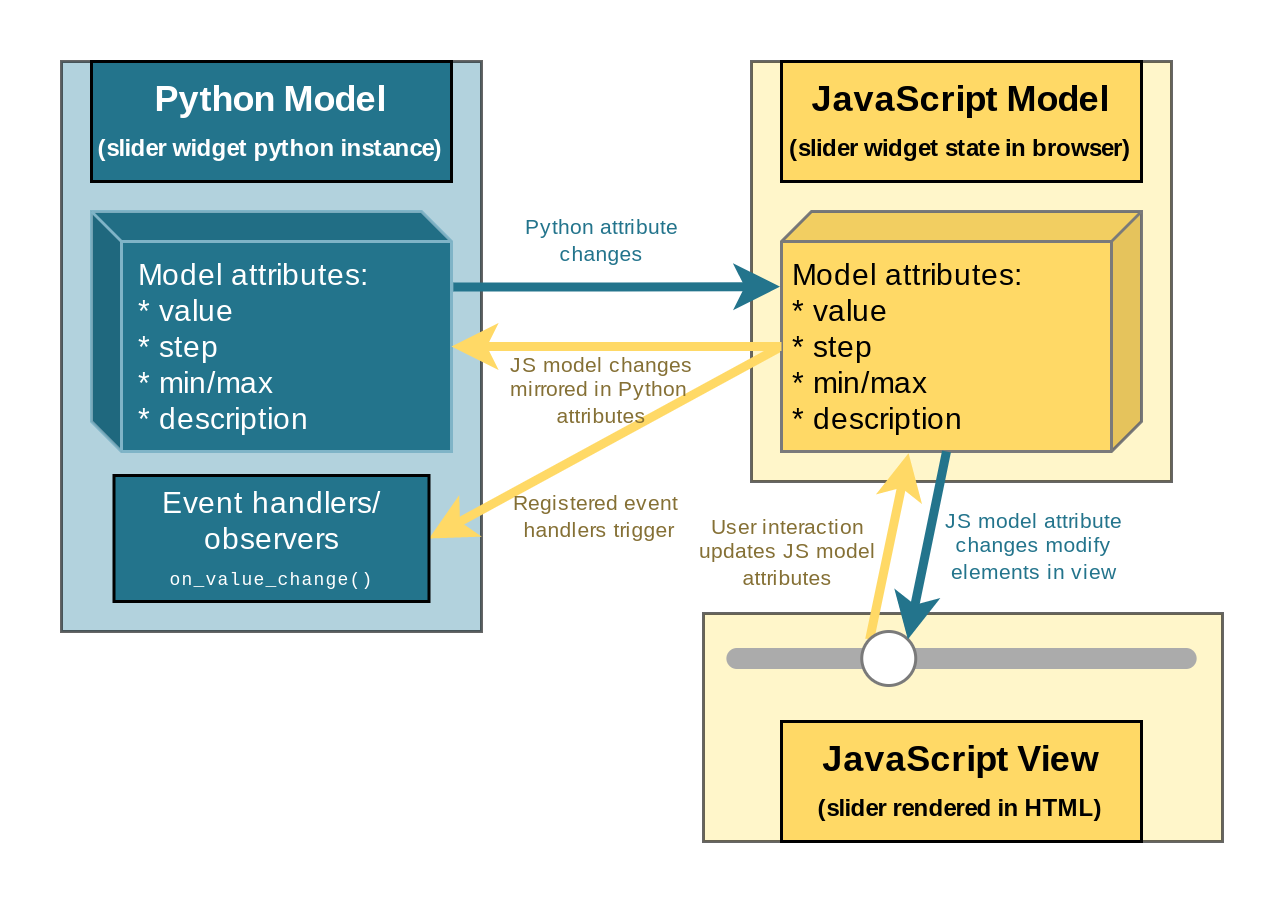
Figure 3:State mirroring between models and view interaction for an example slider widget.
Figure 3 shows a simplified view of the communication channels between the Python model and the JavaScript model/view for an example slider widget. Modifying an attribute on the Python model sends the modification to the JavaScript model, where any changes that would modify the visual aspects of the widget are communicated to the JavaScript view (e.g., a change in the slider value would correspondingly update the position of the slider indicator within the track). Similarly, a user interacting with the widget (e.g., moving the slider within the track) updates the JavaScript state, which communicates this change to the Python model and calls any event handlers listening for changes to the value.
2.2Common Framework
One of the most important benefits of IPyWidgets is that it provides a low-level framework abstracting away many of the specifics for how communication between a kernel, server, and frontend takes place. This framework can be used to design new widgets by providing implementations for the models and view code, without needing to reinvent the various messaging system mechanisms that solve the state synchronization problem discussed previously. All of this has allowed many libraries to emerge, providing novel functionality, a great diversity of new types of widgets, and other frameworks that can support rendering IPyWidgets within other contexts.
2.3Limitations
Despite the flexibility of IPyWidgets as a framework and its value as a core-enabling technology for user interaction, we explicitly highlight some of the limitations of using IPyWidgets as a library of components alone. These limitations motivate the use of some of the many existing libraries that extend and build on top of the IPyWidgets framework, as well as our own work in the IPyOverlay implementation.
2.3.1Components
The set of default components included in the IPyWidgets library cover all
standard form elements such as buttons, drop-down menus, and text fields, as well as a
generic Output widget. The Output widget can render any of the MIME-types
supported by normal Jupyter cell outputs, including Markdown, images,
plots, and even raw HTML. Additionally, there are basic layout components to
stack other widgets vertically, horizontally, or via tabs, all of which can be
nested to allow grouping widgets.
Although these components are often more than sufficient for simple visualizations,
more complex interfaces with richer interaction paradigms can be hard to achieve.
Some examples of dashboard elements that cannot be created
with IPyWidgets’ default components include interactive data frames, dialog
windows, and floating buttons.
2.3.2Events
Another limiting factor for creating more complex interactivity is the type of events that can be observed on the components. UIs are inherently event-driven; the user interacts with widgets/visualizations, and these events run code that update the interface. This is most often implemented by registering “observers” or event-handlers, which tells IPyWidgets to run a specified function every time a particular event is raised. In practice, for the default components provided by the IPyWidgets library, this is mostly limited to value changes (e.g., a slider is moved, the text in a textbox is changed, or an item in a drop-down menu is selected).
These types of events are sufficient for basic interfaces, but often more complex types of interactions can greatly enhance the capabilities of a tool. The ability to detect mouse events can be crucial, enabling possibilities such as highlighting parts of a visualization when the mouse hovers over a row in a dataframe, or running an analysis when a user has highlighted a piece of text from a document. These types of user actions are not feasible with the default widgets.
2.3.3Custom Styling and Layout
Web pages and dashboards that need more complicated layouts than conventional linear stacks and grids of elements generally need to use CSS to control positioning. More than just a mechanism for changing aesthetic and colors, CSS provides rules for structuring the interface. However, this often comes at the cost of greater code complexity and excessive layers of nested elements and rule sets. IPyWidgets components have some capability to modify their CSS but are limited to a subset of rules available through Python attributes. This makes common style changes easier to work with, but the lack of any direct access to arbitrary CSS rules limits more complex layouts, namely the ability to float one widget on top of another.
2.3.4Custom IPyWidget Complexity
A key benefit of IPyWidgets as a framework is that it allows developers to design, build, and publish new components that other people can use in place of or alongside the default widgets. However, the complexity of the infrastructure required to do this with the base IPyWidgets library still makes it challenging to prototype or put together a one-off custom component in a project. Several libraries we discuss in the next section have improved this process substantially, but traditionally a custom component library was developed by starting from a Jupyter-provided cookie-cutter template Jupyter Widgets, 2024 in a separate project.
One of the difficulties that comes with a project created in this way is the need to include the development infrastructure of both a Python and a JavaScript project. JavaScript toolchains and dependency management can quickly become complicated with the number of packages, build system tools, and config files often necessary. Prototyping the component can be a slow process as well, requiring a rebuild on every JavaScript change. Setting up Jupyter to use these unpublished components requires additional environment management to work correctly. Finally, custom widgets built through this method often require fairly significant boilerplate code because the developer is directly in charge of defining all pieces of the Python model, equivalent JavaScript model, and JavaScript view.
3Beyond Base IPyWidgets
IPyWidgets as a low-level widget framework has allowed an ecosystem of other libraries and tools to develop on top of it, dramatically pushing the boundary of what can be constructed and incorporated into interactive dashboards with relative ease. From general plotting tools like interactive Matplotlib (ipympl) Renou et al., 2024, plotly Plotly, Inc., 2019, mpld3 VanderPlas, 2013, altair VanderPlas et al., 2018, and bqplot The BQplot Project, 2015, to more complex or specialized visualization widgets like pythreejs Jupyter Widgets, 2024 and ipyvolume Breddels et al., 2018 for 3D rendering, ipyleaflet Jupyter Widgets, 2024 for interactive maps, and ipycytoscape Meireles, 2020 for interactive networks, there are dozens of packages providing specific components and bridges to JavaScript visualization libraries. Other libraries such as Panel, Solara, and Streamlit provide more holistic integrations between IPyWidgets and other visualization techniques, which can support production-style dashboards for use outside of Jupyter alone. Although these libraries address the limited component set included with IPyWidgets, another class of Python packages exists in this ecosystem that completely changes and improves the workflow for defining new widgets. These workflow improvements eliminate the need for JavaScript toolchains, and in some cases, they also provide the capabilities from various JavaScript web frameworks. A few we briefly touch on here are AnyWidget, IPyReact, and IPyVuetify.
AnyWidget Manz, 2024 is a recent library that has become
influential in the past year. New widgets can be created by simply
extending the Python anywidget.AnyWidget class, defining the class attributes
that are to be synced between the Python and JavaScript models using the
traitlets library IPython Development Team, 2001, and providing a string of
JavaScript code that specifies the view rendering logic. Much of the JavaScript
MV* boilerplate code is abstracted away, and component development can be done without
any JavaScript project infrastructure, specialized cookie cutter, or separate
environment setup. Fundamentally, this type of approach allows even developing
widgets directly within a notebook, rather than doing so in a separate project.
AnyWidget is used in another project called IPyReact Breddels, 2023, which brings
the ReactJS library to support component-based design and allows wrapping
many existing React components.
A similar library we focus on in this work that addresses all of the main limitations of IPyWidgets is IPyVuetify Buikhuizen, 2019, which brings many of the capabilities of Vue.js into IPyWidgets. Vue.js is a web component framework similar to React and emphasises a component-driven design, where a single Vue file can contain an entire component: the template HTML to render, the CSS to apply, and the JavaScript to provide any interactivity and mechanisms to connect it to the rest of the application. Attributes within the HTML can be bound to JavaScript variables, which makes it possible to easily automate the JavaScript model view updates. IPyVuetify brings two main advantages: a large library of flexible premade components and the ability to easily define new components on the fly using Vue to simplify the resulting JavaScript code.
3.1Vuetify Component Library
IPyVuetify is an IPyWidgets port of the Vuetify component library, a set of more
than 70 premade material design Google, 2014 UI widgets. Most of these components support a
fairly extensive set of attributes and properties to change both appearance and
functionality. More importantly, each IPyVuetify widget generally has multiple types of events
that can be observed. A simple example would be a textbox form input component.
In IPyWidgets, the Text widget can mostly only observe a value change when the
user changes the text inside. The IPyVuetify TextField can additionally raise
events for key presses, mouse clicks, the element gaining and losing focus, as
well as any HTML event. This level of control can be useful, for example, when a
text value change triggers a heavy processing task. The interaction is more
responsive when the computation is delayed until the field loses focus or the
user has pressed enter, rather than restarting the computation on every letter
the user adds or removes.
All of the default components in IPyWidgets similarly have more flexible versions and many additional components in IPyVuetify. Figure 4 shows a small sample of default IPyWidgets on the left with their corresponding IPyVuetify versions on the right. Also pictured at the bottom is the Vuetify DataTable, which is an example of a component that is not in the default IPyWidgets. The DataTable allows interactivity to be added to a table supporting filtering, searching, and both client/server side pagination. Other examples of useful UI elements IPyVuetify adds are various layout widgets like navigation drawers, dialog windows, and steppers.
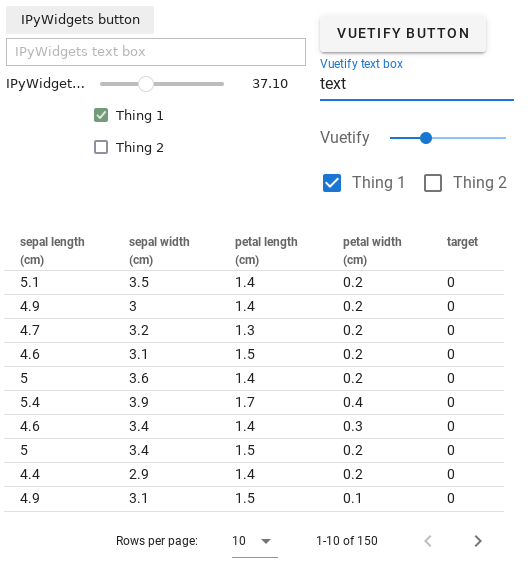
Figure 4:A visual comparison of a few IPyWidget components on the upper left and their corresponding IPyVuetify components on the upper right. The table on the bottom is a DataTable component, an example of a widget which does not have a default IPyWidgets equivalent.
Finally, the Python API for every IPyVuetify component includes the ability to set CSS class and style attributes. The former of these provides access to a long list of predefined classes for easy and consistent control of colors, spacing, and other attributes. For anything not covered by these classes or separate attributes already part of the Vuetify components, the style attribute controls the raw in-line CSS applied to the element.
3.2Custom Vue Components
IPyVuetify provides clean abstractions and mechanisms for creating custom
components. Similar to AnyWidget, IPyVuetify allows defining a Python model
class with synced traitlets, all of which are automatically available within
the JavaScript code. In IPyVuetify’s case, the frontend code is expected to be a
string of Vue code or a path to a Vue file, which allows for fairly
self-contained HTML, JavaScript, and styling. The design of Vue.js lends itself
well to reducing boilerplate by allowing bindings in the HTML to directly refer
to Python attribute traitlets, removing both the need to specify the attribute
in the JavaScript model as well as the function to update the view from the
model. We discuss this further in the section on implementing IPyOverlay in
IPyWidgets. Program 3 exemplifies this,
defining a custom button with a color change on toggle, where the colors can be
modified from Python as well, shown in Figure 5. In this
particular example, both the @click event and :color property directly bind
to the Python attributes, and no explicit JavaScript is necessary. Finally,
IPyVuetify makes it easy to directly call functions across the
Python--JavaScript link by making any Python functions prefixed with vue*available within JavaScript and any JavaScript functions
prefixed withjupyter\_ callable from Python.
1 2 3 4 5 6 7 8 9 10 11 12 13 14 15 16 17 18 19 20 21 22 23 24import traitlets import ipyvuetify as v class ColoredToggleButton(v.VuetifyTemplate): color1 = traitlets.Unicode("var(--md-light-blue-500)").tag(sync=True) color2 = traitlets.Unicode("#AA6688").tag(sync=True) state = traitlets.Bool(True).tag(sync=True) @traitlets.default("template") def _template(self): return """ <template> <v-btn width="300px" :color="state ? color1 : color2" @click="state = !state" >Press to change color!</v-btn> </template> """ button = ColoredToggleButton() # render the button button
Program 3:An example of a custom IPyVuetify component. color1, color2, and state are all part of the automatically synced models. We can refer to them in the Vue bindings as shown on lines 15 and 16, where line 16 is an inline event handler that modifies the state property when the button is clicked. Updating the traitlets on the Python model updates the referenced values in the Vue bindings, e.g. button.color2 = "var(--md-green-600)" changes the second color programmatically.
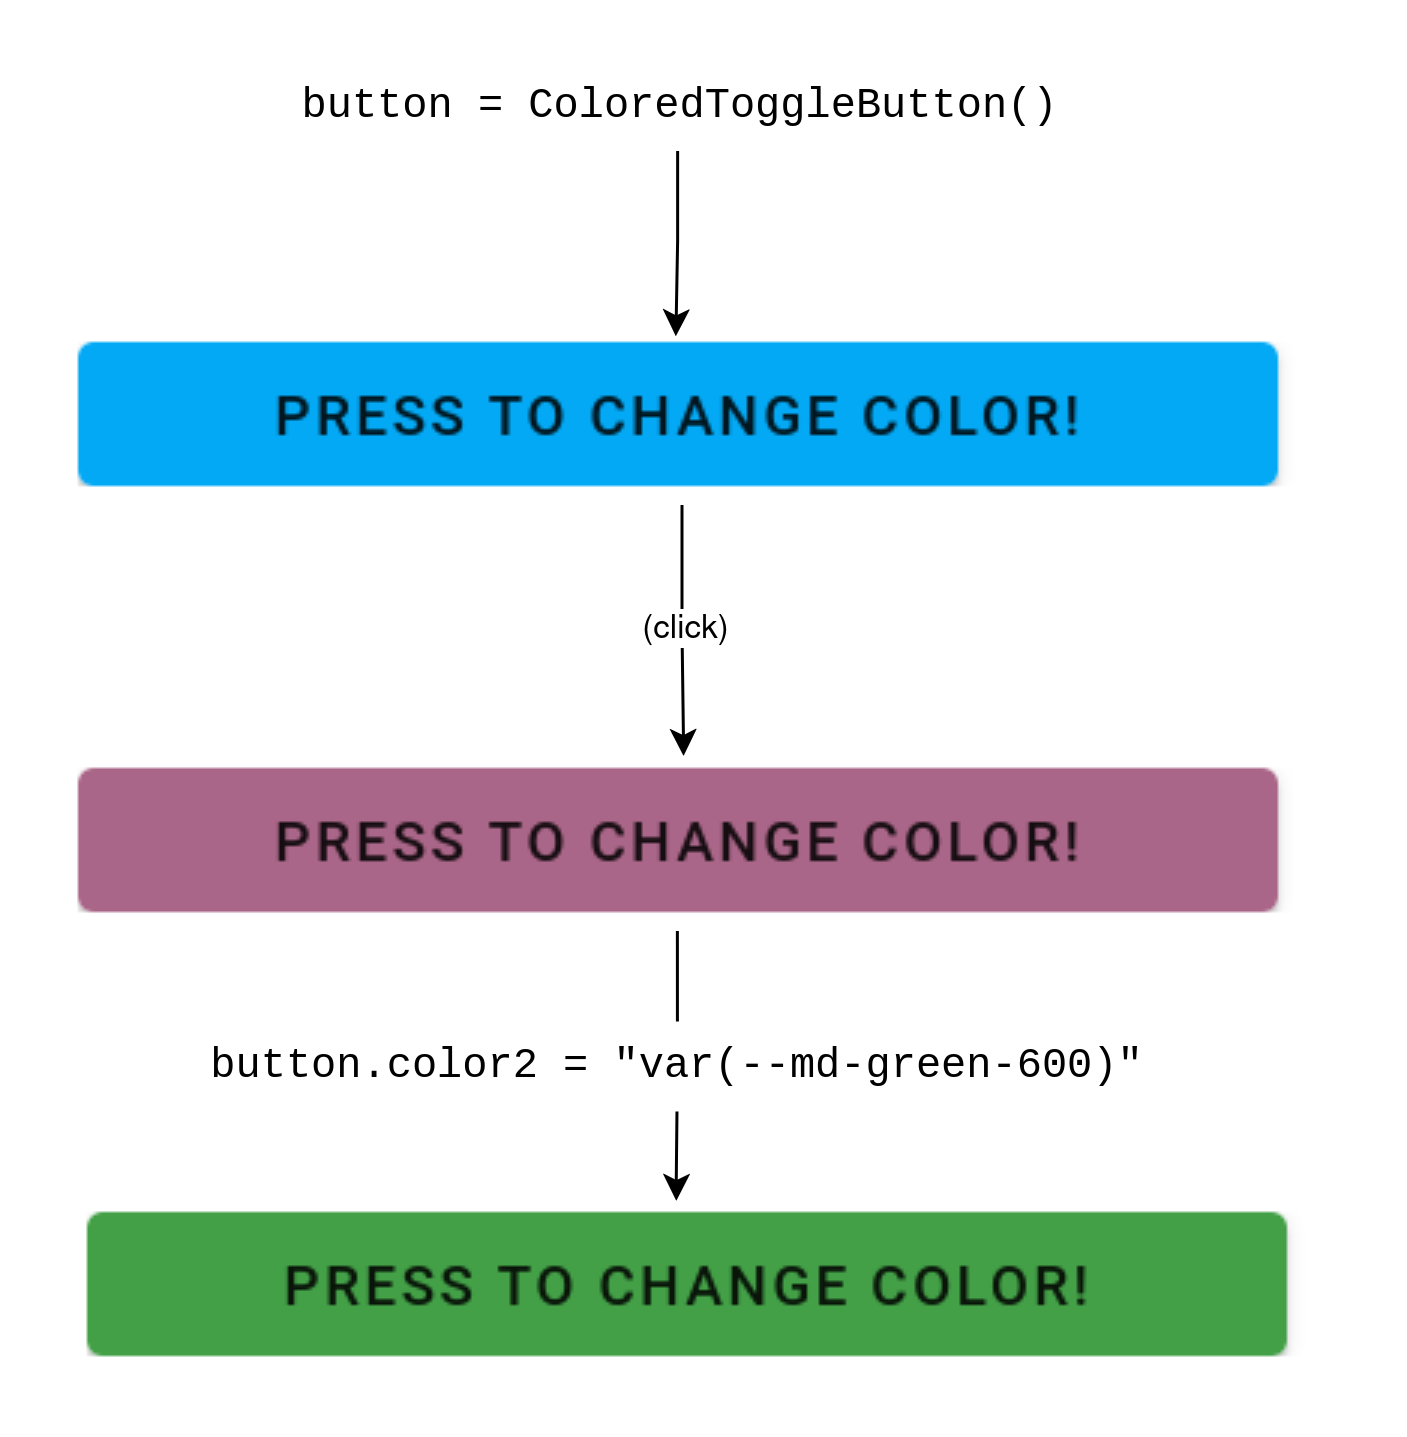
Figure 5:An instance of the ColoredToggleButton from Program 3. Clicking the button switches to color2, and modifying the Python property color2 immediately updates the button to the new second color.
4IPyOverlay
IPyOverlay is a Python library the authors have implemented and open-sourced[1] that uses IPyVuetify to provide several wrapper components for other IPyWidgets. These components add novel UI capabilities within the IPython ecosystem designed to enable details-on-demand interaction paradigms. Namely, we implement support for rendering widgets on top of other widgets with arbitrary and controllable positioning. This capability enables techniques such as click-and-draggable overlay windows containing any other widget. An example of IPyOverlay in action is shown in Figure 6. Throughout this section we will discuss an example use case where we worked with one of the authors, a seismologist, to construct a dashboard for exploring models trained on seismic data. This use case led to the development of IPyOverlay as a library.
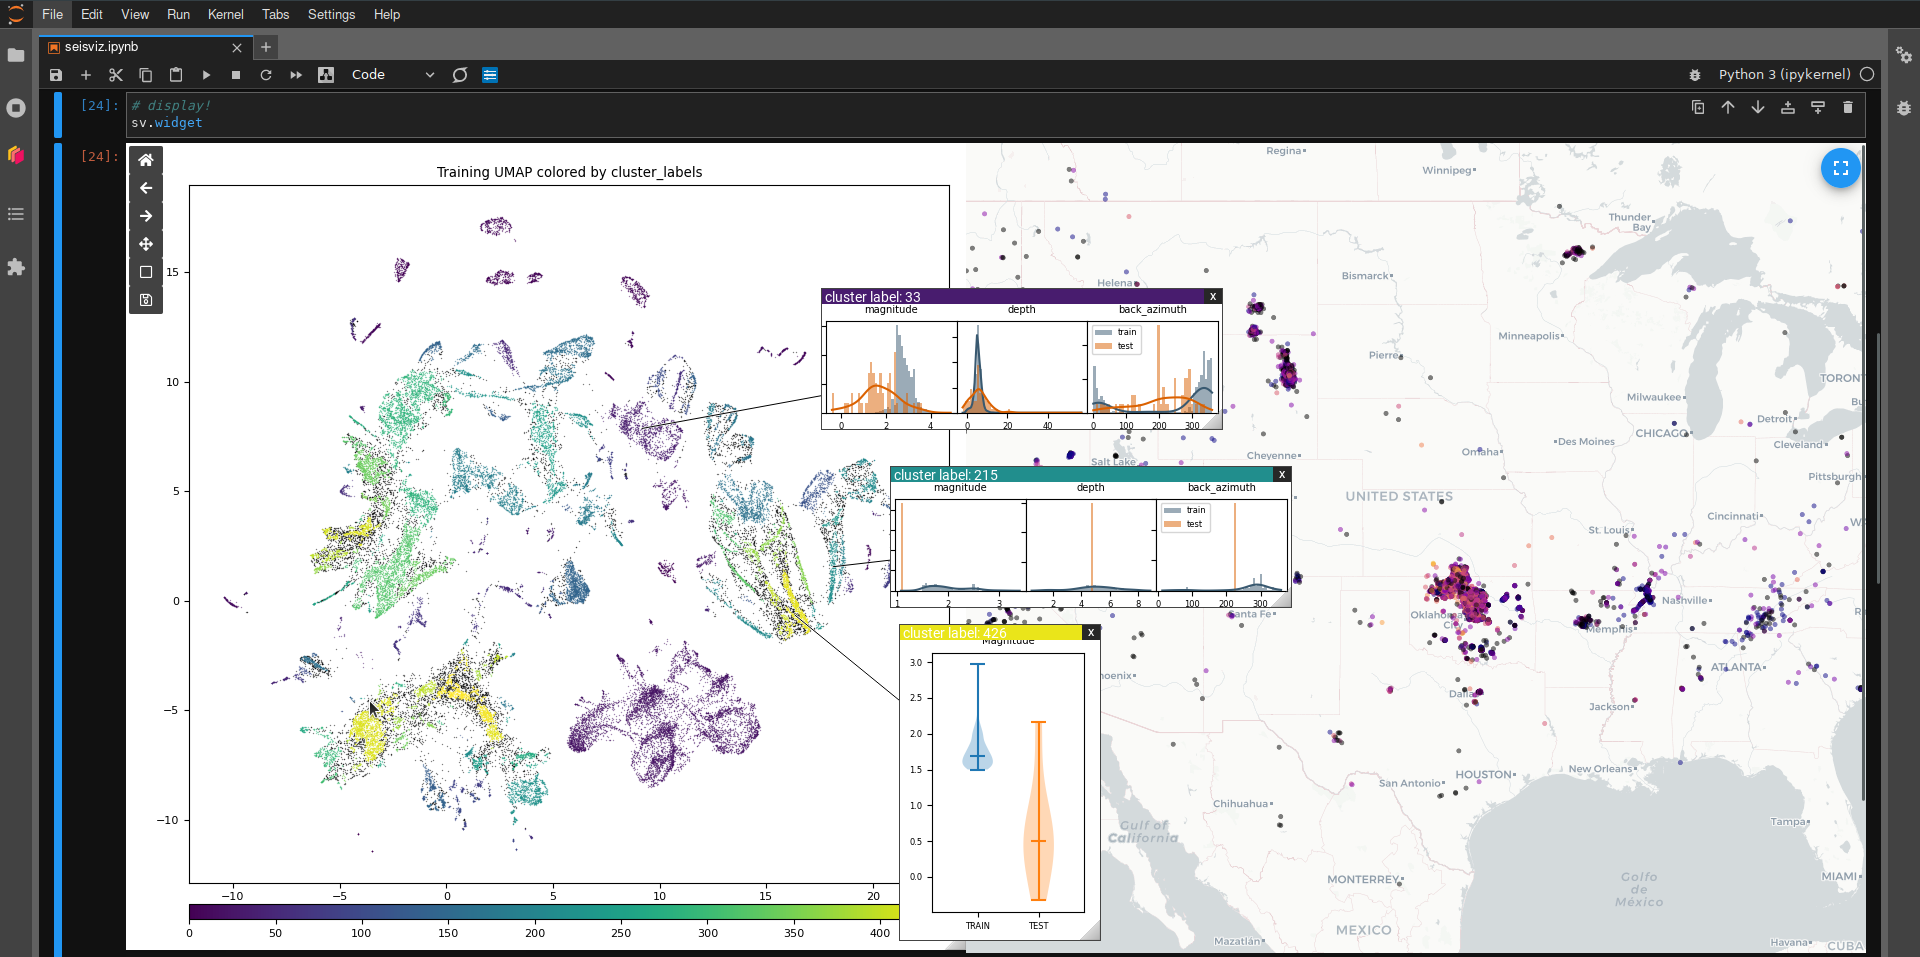
Figure 6:A dashboard for exploring seismic station data embedded with a self-supervised encoder model. The background layout is a Matplotlib UMAP and a plotly geographic map. Pictured are three draggable overlay (“windowed”) Matplotlib plots (with colored bars on top) that provide additional details for user-selected clusters found within the UMAP.
The application in this use case is a tool to assist in evaluating how a model internally represents data from seismic events. Determining properties about a seismic event’s source is a critical part of analyzing and interpreting observed seismic signals, and large deep neural networks are increasingly useful for this task. Qualitatively assessing how well trained models perform on these types of problems, both as a model developer as well as an end user, requires hypothesis testing that visualization can help make substantially easier.
In this use case, the dashboard is constructed with IPyWidgets and IPyOverlay, taking advantage of the techniques described in this section, to determine the success of training a model to meet our domain-specific criteria. More specifically, we use Barlow Twins Zbontar et al., 2021 as a self-supervised learning objective to try to force a model’s learned representations to reflect source properties rather than other observational characteristics. For example, different geographic locations will observe slightly different signals of the same source event based on geological differences in the paths to those locations from the source. An ideal model would exhibit path invariance and represent these signals similarly. We use the constructed visualization tool along with metadata (information other than the timeseries the model was trained on, e.g. event location, depth, distance) to understand how well the training objective succeeds in learning invariance to the metadata attributes that are unrelated to the event source properties. Additionally, we use the dashboard to help end users understand how well the model generalizes to new sources and to explore uncertainty.
The dashboard includes a UMAP McInnes et al., 2018 plot of signals embedded by the model under exploration. Each datapoint is a single observed seismic signal, and these data points are then clustered with DBSCAN Ester et al., 1996. Metadata attributes aggregated by cluster can be explored by clicking within the UMAP ipympl plot, which aids in determining how much correlation exists for those attributes within that cluster. Invariant properties would tend to show as spread out distributions, while attributes that heavily inform a models’ embedding would tend to cause clustering and produce narrow distributions.
4.1Implementing in IPyWidgets
Within base IPyWidgets, there is no straightforward way of constructing a layout in which one widget is overlaid on top of another. Certain other libraries have limited functionality for this within their own widget instances. For example Matplotlib and plotly can display an axes within another axes. Furthermore, many libraries support basic tooltips with arbitrary textual content. Others such as IPyVuetify support certain types of limited “dialog” overlays, which can contain inner widgets and display overtop of the rest of the webpage, but do not support the same type of arbitrary positioning necessary for some details-on-demand approaches.
This limitation seems to arise primarily from the conventional layout mechanisms
employed by many widget libraries, which consists of nesting rows and columns
(HBox and VBox from IPyWidgets) of CSS-flexbox style layouts, or even
stricter grid layouts.
These approaches are generally easier to design and work
with, and abstract away or entirely avoid some of the messier CSS layout rules
required to render HTML elements that do not follow an ordered top-to-bottom/left-to-right flow.
Fundamentally, to enable overlay layouts, we implement
custom IPyWidget containers that use specific CSS rules to control for
nonlinear layouts, namely relying on absolute positioning (by setting
position: absolute), and each child widget setting left and top CSS
properties to have pixel-level control of its location relative to the parent
container. A diagram demonstrating this design principle is shown in
Figure 7.
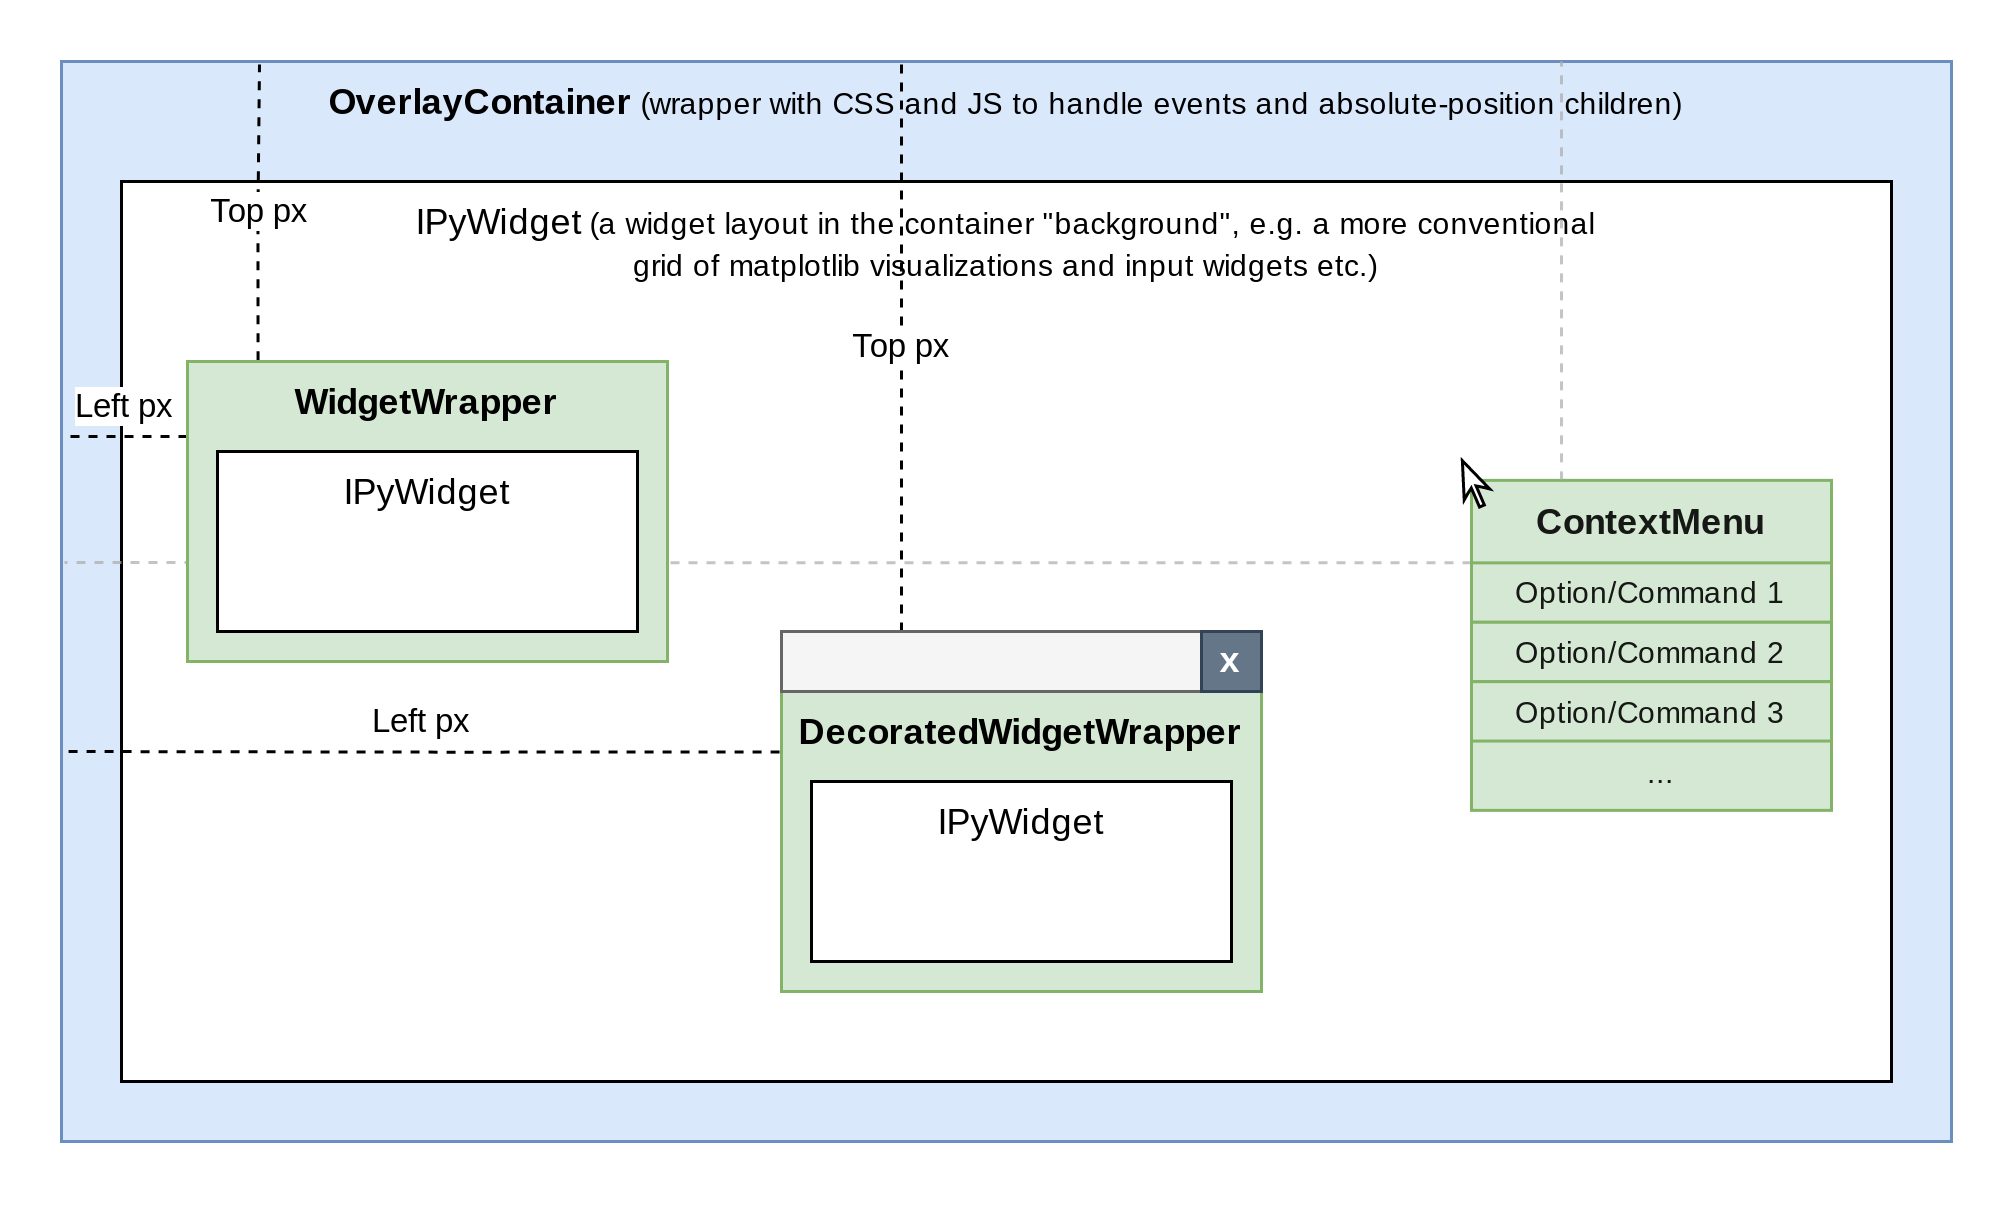
Figure 7:Component wrappers provided by IPyOverlay (discussed in the following section) demonstrating how the positioning works for absolutely positioned child widgets.
4.2Embedding IPyWidgets in IPyOverlay Containers
A key enabler is IPyVuetify’s ability to embed other IPyWidgets inside
of the template HTML, allowing us to construct custom layouts of one or more
child widgets, similar to HBox and VBox in IPyWidgets. In effect, we can
wrap any other widget with custom HTML, CSS, and JavaScript. The Vue framework
is particularly well suited to concise implementation with this approach.
Vue-flavored template HTML supports binding reactive properties on attributes
(e.g., <div :width="some_JS_variable_name">), meaning we can reference any
model variables in the template syntax, and any time those attributes update,
the corresponding HTML is automatically updated without other code having to monitor and
orchestrate the JavaScript model view update. Additionally, Vue’s
template syntax supports several programmatic control structures such as looping
(v-for) and conditionals (v-if), all of which combined allows
declaratively constructing a bound list of child widgets each wrapped in custom
HTML that reactively responds to list updates and other model property changes.
A simplified example is shown in Program 4.
1 2 3 4 5 6 7 8 9 10 11 12 13 14 15 16 17 18 19 20 21 22 23 24 25 26 27 28 29 30 31 32 33 34 35 36<template> <div class="ipyoverlay-container"> <!-- iterate and create a div container for every child in the python model (children is a list of IPyWidgets) --> <div v-for="(child, index) in children" class="ipyoverlay-child-container" :style="{ left: childPosLeft[index]+'px', top: childPosTop[index]+'px' }" > <!-- embed the IPyWidget --> <jupyter-widget :widget='child' /> </div> </div> </template> <script> module.exports = { data() { return { // any values in the data dictionary can be used reactively within // the template HTML childPosLeft: [], childPosTop: [], }; }, } </script> <style> .ipyoverlay-container { display: block; } .ipyoverlay-child-container { display: block; position: absolute; } </style>
Program 4:A simplified version of the Vue template for OverlayContainer. The <div> tag with v-for reactively produces a <div> tag for each widget in the children list attribute within the Python model. Note, the style attribute is bound and references the position arrays on lines 21--22. Changing the position of each overlay widget is done by modifying the corresponding values in these arrays. We keep these arrays only on the JavaScript side to prevent undue traffic between the Python and JavaScript models from high-frequency events (e.g., mouse movements) that can cause significant lag in the interface.
Our primary contribution with IPyOverlay is an OverlayContainer widget, which creates a
container <div> tag embedding a background (nonoverlay) widget, which can
consist of a more traditional grid-like layout of nested rows/columns of other
IPyWidgets, and absolutely positioned floating <div> tags for each
child widget. To support additional functionalities in any of the child
overlay widgets, such as the ability to click and drag to move them, we
provide a WidgetWrapper (clicking anywhere within begins the drag) and a
DecoratedWidgetWrapper (a bar is rendered above the widget which can be
clicked and dragged to move the entire widget.) An example is shown in
Figure 8, where the background widget is an ipympl Matplotlib plot and
three DecoratedWidgetWrapper’s that embed additional ipympl Matplotlib plots
are floating freely above the background.
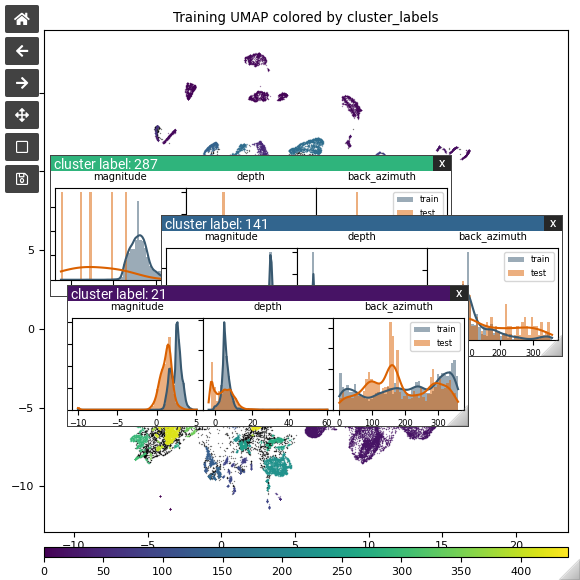
Figure 8:Three DecoratedWidgetWrapper widgets, each wrapping an ipympl widget with more
in-depth plots detailing distributions of attributes within selected clusters.
4.3Connection Lines
A potential concern with free-floating details-on-demand overlays is the dissociation from the underlying data: if a user opens more than a couple overlays that correspond to specific pieces of an underlying visualization, it is easy to lose track of the overlay widgets and the pieces they are associated with. In the example use case, clicking on a cluster within the UMAP opens distribution plots for data within that cluster. Because of the number of clusters, it can be difficult to determine which distribution plot belongs to which cluster. IPyOverlay adds the ability to render lines connecting overlay widgets to specific pieces of the background widget (Figure 9).
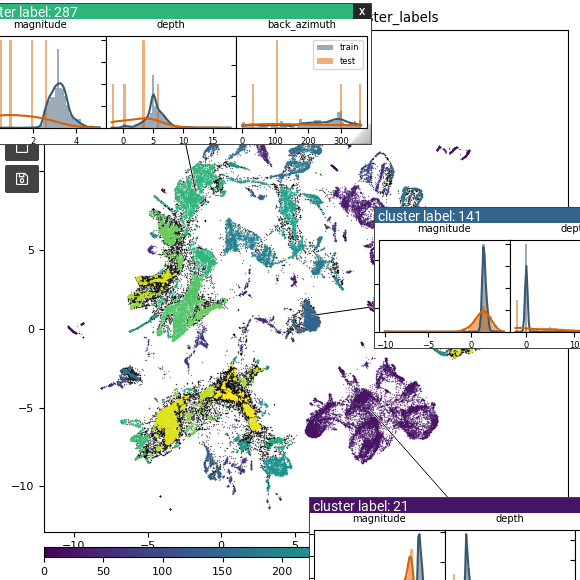
Figure 9:The same detail plots as in Figure 8. The overlay widgets have been dragged further out to show the connection lines to the clusters in the UMAP each is based on.
One end point of the line is always associated with a specified overlay widget and is automatically updated to the widget’s center whenever it is moved. The other side of the line can be “attached” in a few different ways, including simply specifying pixel coordinates within the background, but a significant challenge is locations within dynamic content such as interactive plots that can be panned and scaled. The conceptual approach to solving this for many plotting libraries is to store the x/y data point the connection should point to, the initial ranges of any plot axes, and current pixel boundaries of the plot within the container. Then, listening for any events that indicate an axis range has changed, handler functions can recalculate pixel locations based on the new relative position of the x/y data point within the new range.
Unfortunately, in practice, the functions necessary to do this for different plotting libraries can vary substantially as a result of implementation differences. At the time of this writing, IPyOverlay only supports autoupdating connections for dynamic content inside of ipympl (Matplotlib) and plotly plots. The authors intend to continue expanding the set of supported visualization libraries for this particular feature.
4.4Context Menus
A common form of details-on-demand feature in UI design across most platforms is the context menu.
Generally initiated from a right-click in desktop operating systems and
applications, or tapping and holding on a mobile device, context menus provide a
localized and easy to access palette of possible commands to run at the
current location. Complex dashboards can often have many different possible
actions for the user to take, and simply displaying all of these as buttons may
overwhelm or clutter the interface. Alternately, the actions may be too component/position specific
to work well as buttons. Context menus fill this role by hiding these commands until
the user requests them by right-clicking and supporting different menus when
over different components.
Displaying a context menu similarly requires
rendering some form of widget over another -- IPyOverlay includes a
ContextMenuArea component that can wrap any widget within an
OverlayContainer and define a context menu with options and event handlers for
that specific component. In the example use case, we add a context menu to
the scatter plot to allow a user to optionally choose between displaying a
violin plot with the distributions versus the density plots (Figure 10).
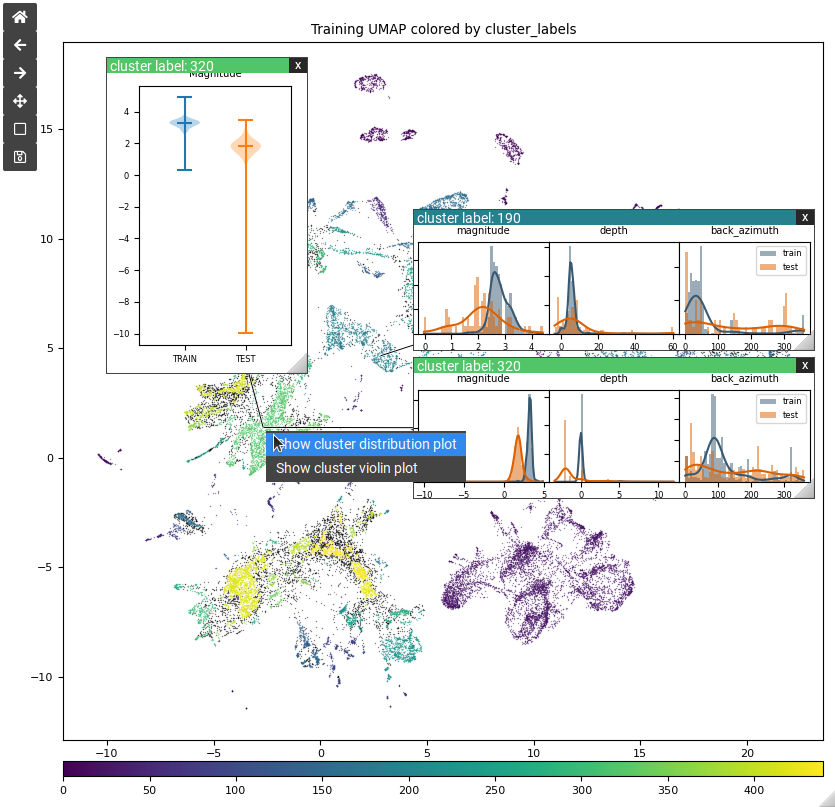
Figure 10:An activated context menu providing a selection of commands, which can be expanded well beyond the single possible action that can be taken from a left-click.
4.5Example Usage
A minimal code example using IPyOverlay’s containers and connection lines is shown in Program 5. The example renders an interactive ipympl scatterplot of random data, and clicking on a point renders a connected overlay window with a bar chart of additional data associated with the point. A screenshot of this output is shown in Figure 11.
1 2 3 4 5 6 7 8 9 10 11 12 13 14 15 16 17 18 19 20 21 22 23 24 25 26 27 28 29 30 31 32 33 34 35 36import ipyoverlay as ui import matplotlib.pyplot as plt import numpy as np %matplotlib widget # make random data to plot - the first two dimensions are x and y coords # and the latter 3 are associated data we want to see in inset plots data = np.random.rand(100, 5) # plot the scatter data dimensions fig, ax = plt.subplots() ax.scatter(x=data[:,0], y=data[:,1]) # make an IPyOverlay Container to wrap the ipympl figure to allow inset plots container = ui.OverlayContainer(fig.canvas, height="auto", width="auto") def on_point_click(point_index, event): # get the data associated with selected point data_point = data[point_index] category_bar_data = data_point[2:] # create bar chart for selected point inset_fig, inset_ax = plt.subplots(figsize=(2,2)) inset_ax.bar(x=[0,1,2], height=category_bar_data) # make a floating IPyOverlay window with the plot and connect it # to the selected point's data location inset_window = ui.DecoratedWidgetWrapper(ui.display_output(inset_fig), title=str(point_index)) container.add_child_at_mpl_point(inset_window, ax, data_point[0], data_point[1]) # attach the event handler to add the inset plot when any of the specified # datapoints are clicked handler = ui.mpl.event.on_mpl_point_click(ax, on_point_click, data[:,0], data[:,1], tolerance=.1) container
Program 5:This snippet wraps an ipympl figure with an OverlayContainer and responds to point clicks by adding a floating DecoratedWidgetWrapper with an additional plot, connected to the clicked point. Note that display_output() is a convenience function provided by IPyOverlay that can render a static plot into a default ipywidgets Output widget.
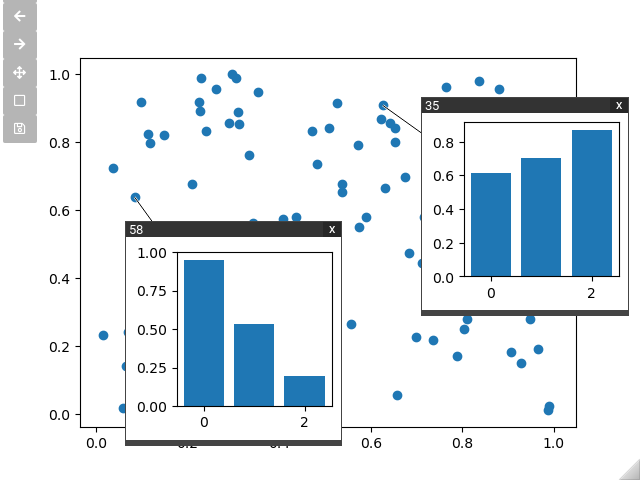
Figure 11:An ipympl scatter plot of random data with two inset plots showing the
additional data associated with each clicked point in a bar chart.
5Conclusion
The prevalence and utility of Jupyter notebooks in data analysis and scientific workflows has prompted the development of a community of tools for interactive visualization. IPyWidgets, the backbone that supports much of this ecosystem, provides the mechanisms for the kernel to mediate communication between Python and JavaScript. A multitude of libraries have built on top of these mechanisms and IPyVuetify in particular offers a collection of well designed and flexible components to use in dashboards and a straightforward abstraction for building custom components in projects based on Vue.js. A missing piece of this ecosystem is the ability to flexibly render localized pop-up windows in support of details on demand. We developed IPyOverlay to provide this capability through wrapper components that can arbitrarily position widgets on top of other widgets, opening the door to more types of visualization and dashboard layouts.
Notice: This manuscript has been authored by UT-Battelle, LLC, under contract DE-AC05-00OR22725 with the US Department of Energy (DOE). The US government retains and the publisher, by accepting the article for publication, acknowledges that the US government retains a nonexclusive, paid-up, irrevocable, worldwide license to publish or reproduce the published form of this manuscript, or allow others to do so, for US government purposes. DOE will provide public access to these results of federally sponsored research in accordance with the DOE Public Access Plan (https://
Copyright © 2024 Martindale et al. This is an open-access article distributed under the terms of the Creative Commons Attribution 4.0 International license, which enables reusers to distribute, remix, adapt, and build upon the material in any medium or format, so long as attribution is given to the creators.
- CSS
- Cascading Style Sheets
- DBSCAN
- Density-Based Spatial Clustering of Applications with Noise
- DOE
- Department of Energy
- HTML
- HyperText Markup Language
- UMAP
- Uniform Manifold Approximation and Projection
- Kluyver, T., Ragan-Kelley, B., Pérez, F., Granger, B., Bussonnier, M., Frederic, J., Kelley, K., Hamrick, J., Grout, J., Corlay, S., Ivanov, P., Avila, D., Abdalla, S., Willing, C., & Jupyter Development Team. (2016). Jupyter Notebooks - A Publishing Format for Reproducible Computational Workflows. In F. Loizides & B. Scmidt (Eds.), Positioning and Power in Academic Publishing: Players, Agents and Agendas (pp. 87–90). IOS Press. https://eprints.soton.ac.uk/403913/
- Jupyter Widgets. (2015). jupyter-widgets/ipywidgets. https://github.com/jupyter-widgets/ipywidgets
- Philipp Rudiger, Marc Skov Madsen, Simon Høxbro Hansen, Maxime Liquet, Andrew, Xavier Artusi, James A. Bednar, Chris B, Jean-Luc Stevens, Demetris Roumis, Julia Signell, Christoph Deil, Mateusz Paprocki, Jon Mease, Jerry Wu, Arne, Hugues-Yanis Amanieu, thuydotm, Simon, … Ray Bell. (2024). holoviz/panel: Version 1.4.2. Zenodo. 10.5281/ZENODO.11046027
- Breddels, M. A. (2022). widgetti/solara. https://github.com/widgetti/solara
- Shneiderman, B. (1996). The eyes have it: A task by data type taxonomy for information visualizations. Proceedings 1996 IEEE Symposium on Visual Languages, 336–343. 10.1109/VL.1996.545307
- Jupyter Widgets. (2024). Low Level Widget Explanation — Jupyter Widgets 8.1.2 documentation. https://ipywidgets.readthedocs.io/en/latest/examples/Widget%20Low%20Level.html
- Jupyter Widgets. (2024). jupyter-widgets/widget-cookiecutter: A cookiecutter template for creating a custom Jupyter widget project. https://github.com/jupyter-widgets/widget-cookiecutter
- Renou, M., Corlay, S., Hunt-Isaak, I., Silvester, S., Boone, K., Thomas, I., Caswell, T. A., de Andrade, E. S., psteegstra, Nielsen, J. H., Lee, A., Fröhlich, Y., stonebig, Todd, Paine, T., Aarholt, T., Lewis, R., Elson, P., Dunfield, N., … Sundell, E. (2024). matplotlib/ipympl: Release 0.9.4 (0.9.4) [Computer software]. Zenodo. 10.5281/zenodo.10974323
- Plotly, Inc. (2019). plotly/plotly.py: The interactive graphing library for Python. https://github.com/plotly/plotly.py
- VanderPlas, J. (2013). mpld3/mpld3. mpld3. https://github.com/mpld3/mpld3
- VanderPlas, J., Granger, B. E., Heer, J., Moritz, D., Wongsuphasawat, K., Satyanarayan, A., Lees, E., Timofeev, I., Welsh, B., & Sievert, S. (2018). Altair: Interactive Statistical Visualizations for Python. Journal of Open Source Software, 3(32), 1057. 10.21105/joss.01057
- The BQplot Project. (2015). bqplot/bqplot. https://github.com/bqplot/bqplot
- Jupyter Widgets. (2024). jupyter-widgets/pythreejs. Jupyter Widgets. https://github.com/jupyter-widgets/pythreejs
- Breddels, M., Jeammimi, Sewell, C., Satrajit Ghosh, Holdgraf, C., XavArtley, Stonebig, Mpu-Creare, WANG Aiyong, F, T., Badger, T. G., Corlay, S., Kozynets, O., McCormick, M., , Mathieu, Jean-Rémi KING, Leng, J., & Larson, E. (2018). maartenbreddels/ipyvolume: ipyvolume v0.4.5. Zenodo. 10.5281/ZENODO.1286976
- Jupyter Widgets. (2024). jupyter-widgets/ipyleaflet. https://github.com/jupyter-widgets/ipyleaflet
