
The Geoscience Community Analysis Toolkit: An Open Development, Community Driven Toolkit in the Scientific Python Ecosystem
Abstract
The Geoscience Community Analysis Toolkit (GeoCAT) team develops and maintains data analysis and visualization tools on structured and unstructured grids for the geosciences community in the Scientific Python Ecosystem (SPE). In response to dealing with increasing geoscientific data sizes, GeoCAT prioritizes scalability, ensuring its implementations are scalable from personal laptops to HPC clusters. Another major goal of the GeoCAT team is to ensure community involvement throughout the whole project lifecycle, which is realized through an open development mindset by encouraging users and contributors to get involved in decision-making. With this model, we not only have our project stack open-sourced but also ensure most of the project assets that are directly related to the software development lifecycle are publicly accessible.
Introduction
The Geoscience Community Analysis Toolkit (GeoCAT) team, established in 2019, leads the software engineering efforts of the National Center for Atmospheric Research (NCAR) “Pivot to Python” initiative GeoCAT, 2019. Before then, NCAR Command Language (NCL) Brown et al., 2012 was developed by NCAR as an interpreted, domain-specific language that was aimed to support the analysis and visualization needs of the global geosciences community. NCL had been serving several tens of thousands of users for decades. It is still available for use but has not been actively developed as it has been in maintenance mode.
The initiative had an initial two-year roadmap with major milestones being: (1) Replicating NCL’s computational routines in Python, (2) training and support for transitioning NCL users into Python, and (3) moving tools into an open development model. GeoCAT aims to create scalable data analysis and visualization tools on structured and unstructured grids for the geosciences community in the SPE. The GeoCAT team is committed to open development, which helps the team prioritize community involvement at any level of the project lifecycle alongside having the whole software stack open-sourced.
GeoCAT has seven Python tools for geoscientific computation and visualization. These tools are built upon the Pangeo Hamman et al., 2018 ecosystem. In particular, they rely on Xarray Hoyer & Hamman, 2017, and Dask Rocklin, 2015, as well as they are compatible with Numpy and use Jupyter Notebooks for demonstration purposes. Dask compatibility allows the GeoCAT functions to scale from personal laptops to high performance computing (HPC) systems such as NCAR’s Casper, Cheyenne, and upcoming Derecho clusters Craker et al., 2022. Additionally, GeoCAT also utilizes Numba, an open source just-in-time (JIT) compiler Lam et al., 2015, to translate Python and NumPy code into machine codes in order to get faster executions wherever possible. GeoCAT’s visualization components rely on Matplotlib Hunter, 2007 for most of the plotting functionalities, Cartopy Met Office, 2010 for projections, as well as the Datashader and Holoviews stack Anaconda, n.d. for big data rendering. Figure 1 shows these technologies with their essential roles around GeoCAT.
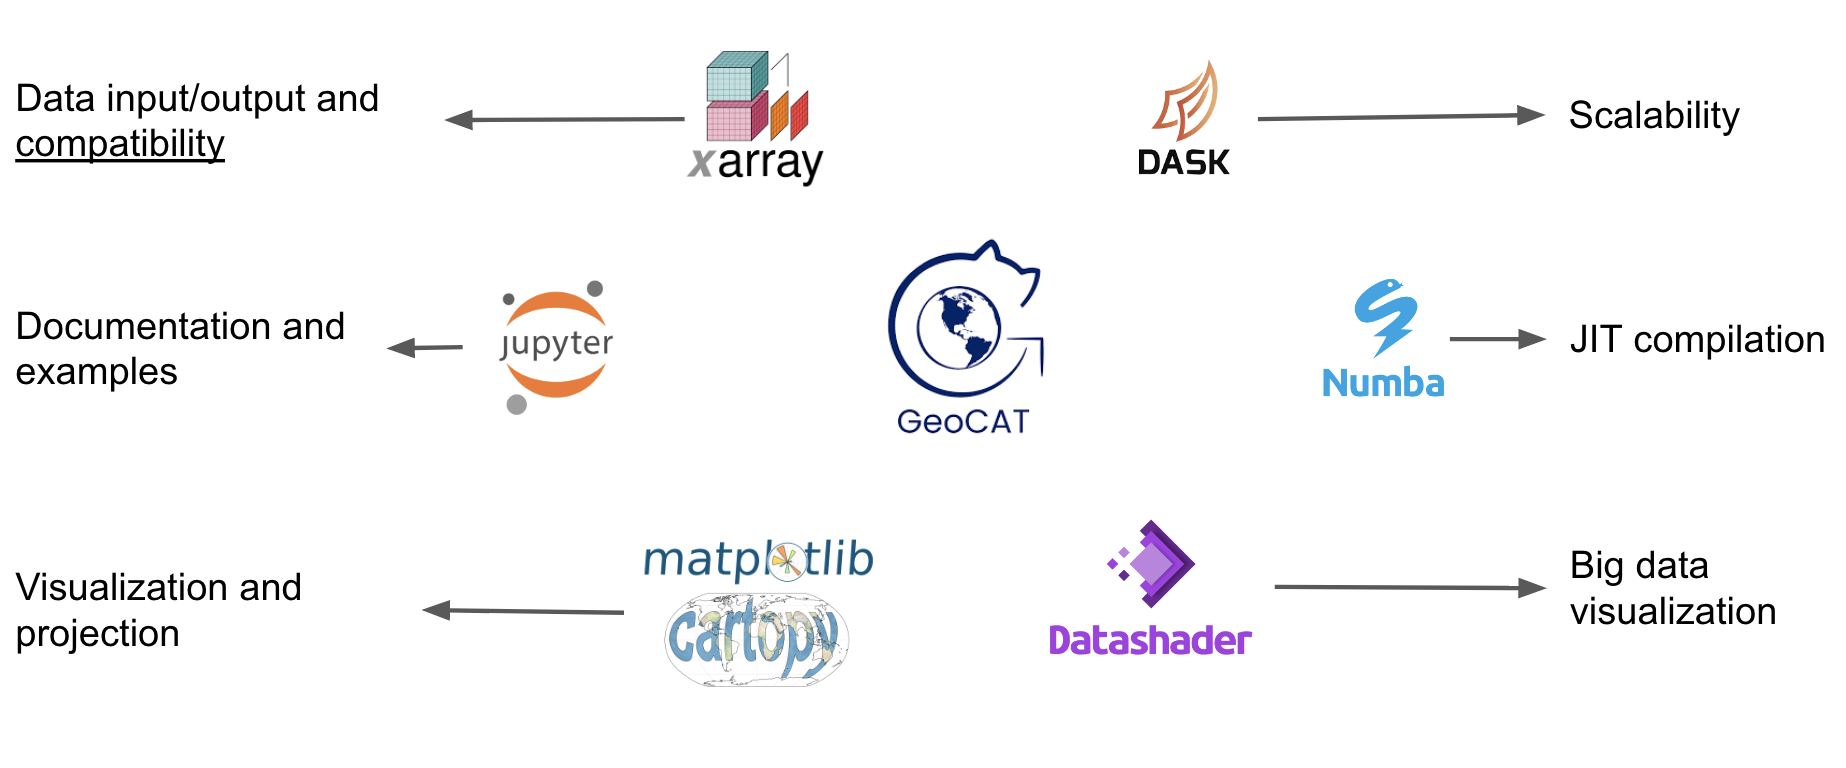
Figure 1:The core Python technologies on which GeoCAT relies on
Briefly, GeoCAT-comp houses computational operators for applications ranging from regridding and interpolation, to climatology and meteorology. GeoCAT-examples provides over 140 publication-quality plotting scripts in Python for Earth sciences. It also houses Jupyter notebooks with high-performance, interactive plots that enable features such as pan and zoom on fine-resolution, unstructured geoscience data (e.g. ~3 km data rendered within a few tens of seconds to a few minutes on personal laptops). This is achieved by making use of the connectivity information in the unstructured grid and rendering data via the Datashader and Holoviews ecosystem Anaconda, n.d.. GeoCAT-viz enables higher-level implementation of Matplotlib and Cartopy plotting capabilities through its variety of easy to use visualization convenience functions for GeoCAT-examples. GeoCAT also maintains WRF-Python (Weather Research and Forecasting), which works with WRF-ARW model output and provides diagnostic and interpolation routines.
GeoCAT was recently awarded Project Raijin, which is an NSF EarthCube-funded effort NSF, 2021Clyne et al., 2021. Its goal is to enhance the open-source analysis and visualization tool landscape by developing community-owned, sustainable, scalable tools that facilitate operating on unstructured climate and global weather data in the SPE. Throughout this three-year project, GeoCAT will work on the development of data analysis and visualization functions that operate directly on the native grid as well as establish an active community of user-contributors.
This paper will provide insights about GeoCAT’s software stack and current status, team scope and near-term plans, open development methodology, as well as current pathways of community involvement.
GeoCAT Software
The GeoCAT team develops and maintains several open-source software tools. Before describing those tools, it is vital to explain in detail how the team implements the continuous integration and continuous delivery/deployment (CI/CD) in consistence for all of those tools.
Continuous Integration and Continuous Delivery/Deployment (CI/CD)
GeoCAT employs a continuous delivery model, with a monthly package release cycle on package management systems and package indexes such as Conda Anaconda, Inc., n.d. and PyPI Python Software Foundation, n.d.. This model helps the team make new functions available as soon as they are implemented and address potential errors quickly. To assist this process, the team utilizes multiple tools throughout GitHub assets to ensure automation, unit testing and code coverage, as well as licensing and reproducibility. Figure 2, for example, shows the set of badges displaying the near real-time status of each CI/CD implementation in the GitHub repository homepage from one of our software tools.
CI build tests of our repositories are implemented and
automated (for pushed commits, pull requests, and daily scheduled execution) via
GitHub Actions workflows GitHub, n.d., with the CI badge shown in
Figure 2 displaying the status (i.e. pass or fail) of those workflows.
Similarly, the CONDA-BUILDS badge shows if the conda recipe works successfully for
the repository. The Python package “codecov” Codecov, n.d. analyzes the percentage
of code coverage from unit tests in the repository. Additionally, the overall results
as well as details for each code script can be seen via the COVERAGE badge. Each of
our software repositories has a corresponding documentation page that is populated
mostly-automatically through the Sphinx Python documentation generator Brandl, 2021
and published through ReadTheDocs ReadTheDocs, n.d. via an automated building and
versioning schema. The DOCS badge provides a link to the documentation page along
with showing failures, if any, with the documentation rendering process.
Figure 3 shows the documentation homepage of GeoCAT-comp. The NCAR and PYPI
badges in the Package row shows and links to the latest versions of the software
tool distributed through NCAR’s Conda channel and PyPI, respectively. The LICENSE
badge provides a link to our software licenses, Apache License version 2.0
Apache Software Foundation, 2004, for all of the GeoCAT stack, enabling the redistribution of the
open-source software products on an “as is” basis. Finally, to provide reproducibility
of our software products (either for the latest or any older version), we publish
version-specific Digital Object Identifiers (DOIs), which can be accessed through
the DOI badge. This allows the end-user to accurately cite the specific version
of the GeoCAT tools they used for science or research purposes.
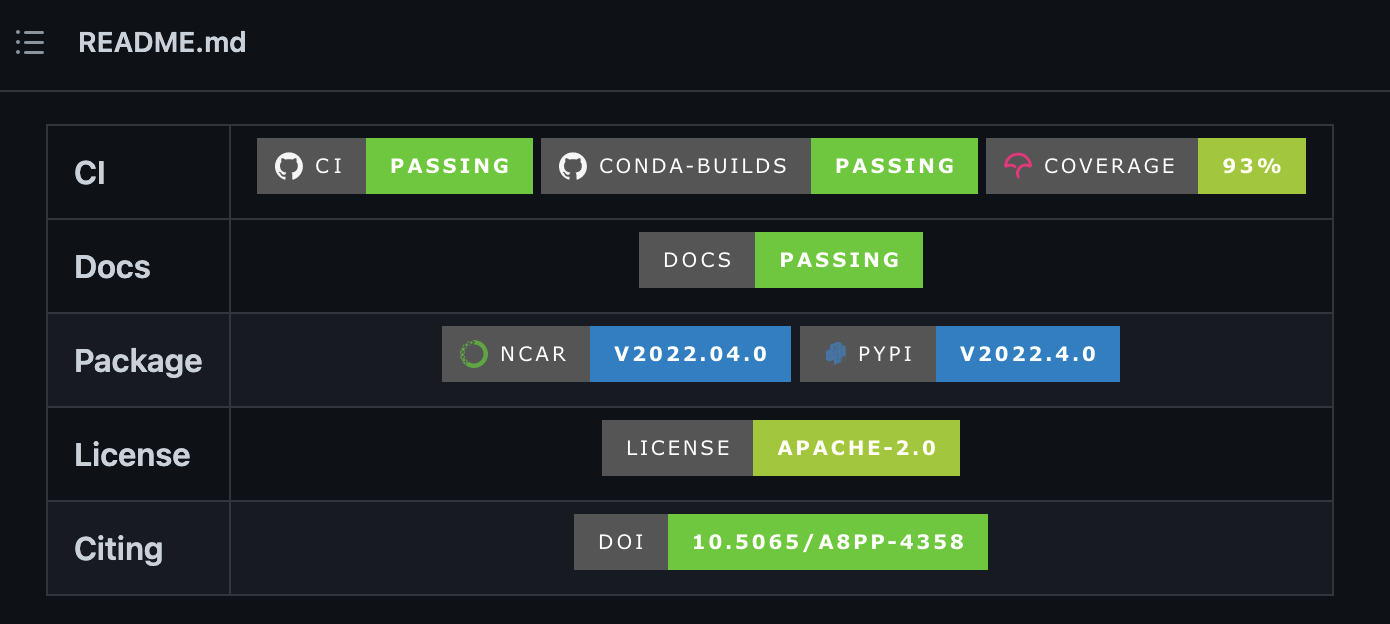
Figure 2:GeoCAT-comp’s badges in the beginning of its README file (i.e. the home page of the Githug repository) GeoCAT-comp GitHub repository, n.d.
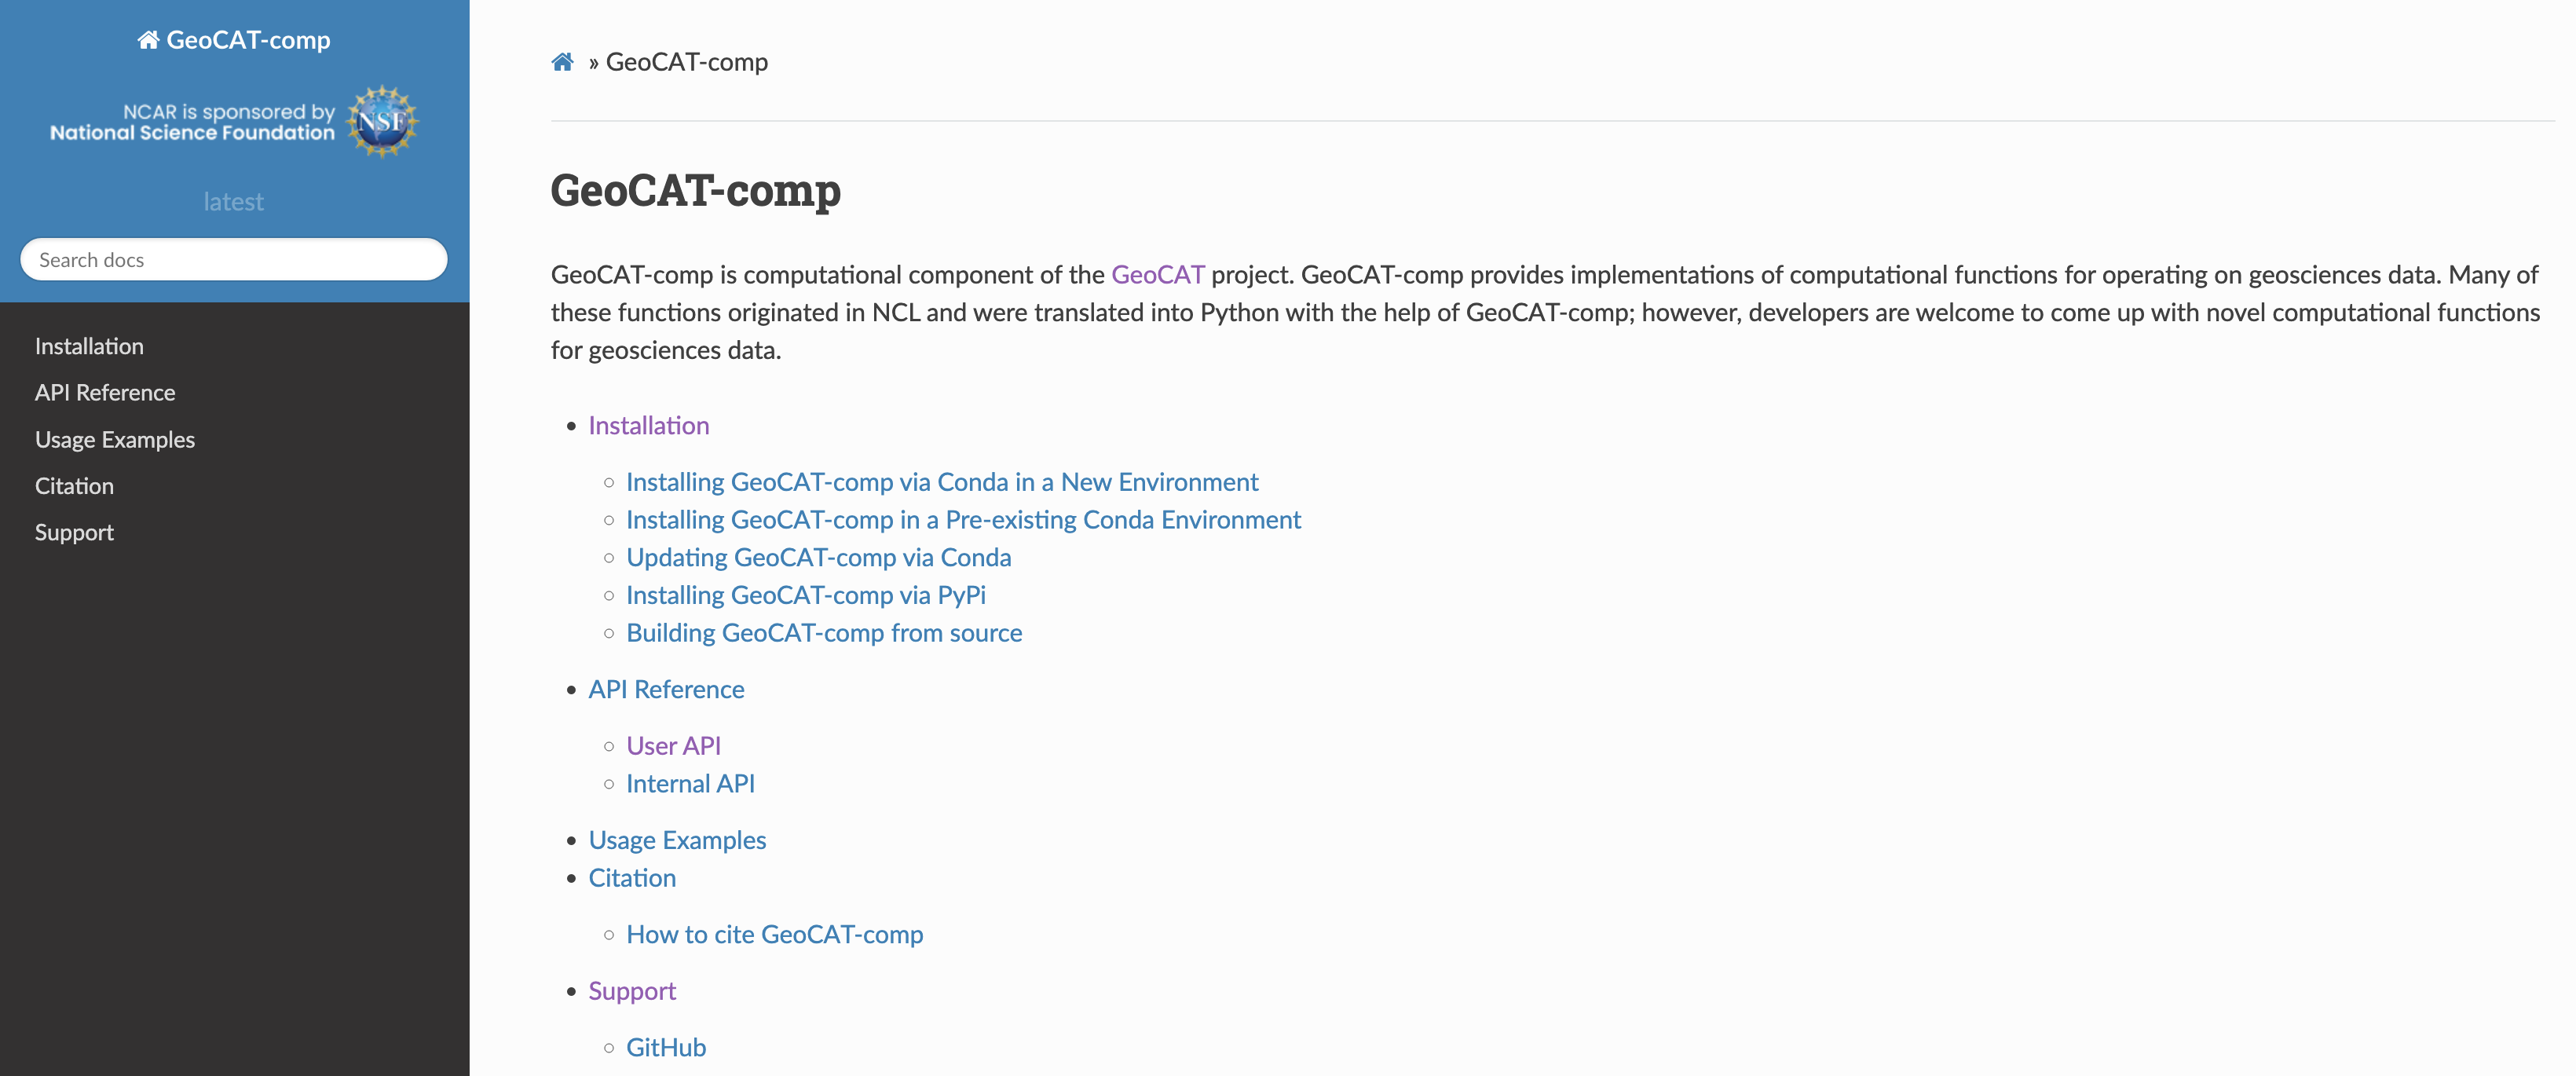
Figure 3:GeoCAT-comp documentation homepage built with Sphinx using a theme provided by ReadTheDocs GeoCAT-comp documentation page, n.d.
GeoCAT-comp (and GeoCAT-f2py)
GeoCAT-comp is the computational component of the GeoCAT project as can be seen in Figure 4. GeoCAT-comp houses implementations of geoscience data analysis functions. Novel research and development is conducted for analyzing both structured and unstructured grid data from various research fields such as climate, weather, atmosphere, ocean, among others. In addition, some of the functionalities of GeoCAT-comp are inspired or reimplemented from the NCL in order to address the first goal of the "Pivot to Python effort. For that purpose, 114 NCL routines were selected, excluding some functionalities such as date routines, which could be handled by other packages in the Python ecosystem today. These functions were ranked by order of website documentation access from most to least, and prioritization was made based on those ranks. Today, GeoCAT-comp provides the same or similar capabilities of about 39% (44 out of 114) of those functions.
Some of the functions that are made available through GeoCAT-comp are listed below, for which the GeoCAT-comp documentation GeoCAT-comp documentation page, n.d. provides signatures and descriptions as well as links to the usage examples:
- Spherical harmonics (both decomposition and recomposition as well as area weighting)
- Fourier transforms such as band-block, band-pass, low-pass, and high-pass
- Meteorological variable computations such as relative humidity, dew-point temperature, heat index, saturation vapor pressure, and more
- Climatology functions such as climate average over multiple years, daily/monthly/seasonal averages, as well as anomalies
- Regridding of curvilinear grid to rectilinear grid, unstructured grid to rectilinear grid, curvilinear grid to unstructured grid, and vice versa
- Interpolation methods such as bilinear interpolation of a rectilinear to another rectilinear grid, hybrid-sigma levels to isobaric levels, and sigma to hybrid coordinates
- Empirical orthogonal function (EOF) analysis
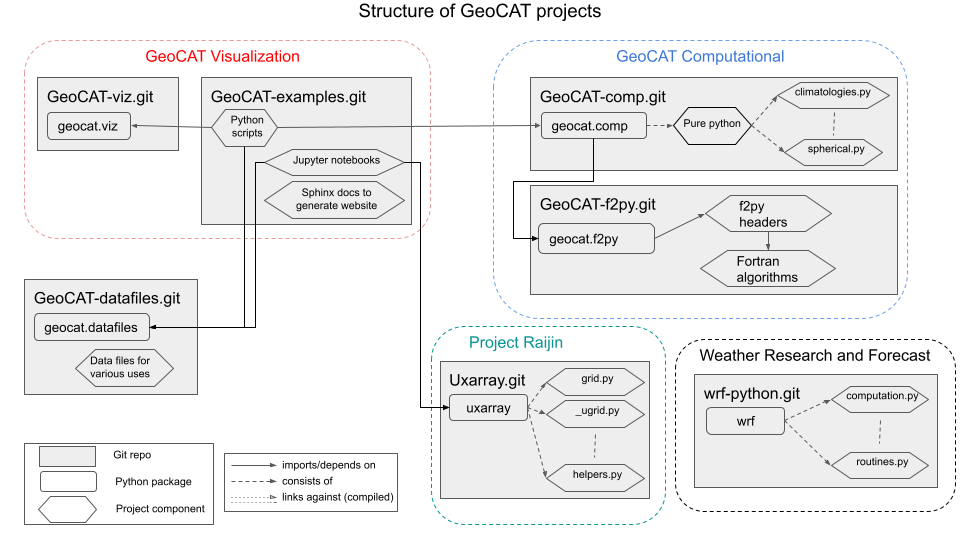
Figure 4:GeoCAT project structure with all of the software tools GeoCAT Contributor's Guide, n.d.
Many of the computational functions in GeoCAT are implemented in pure Python. However, there are others that were originally implemented in Fortran but are now wrapped up in Python with the help of Numpy’s F2PY, Fortran to Python interface generator. This is mostly because re-implementing some functions would require understanding of complicated algorithm flows and implementation of extensive unit tests that would end up taking too much time, compared to wrapping their already-implemented Fortran routines up in Python. Furthermore, outside contributors from science background would keep considering to add new functions to GeoCAT from their older Fortran routines in the future. To facilitate contribution, the whole GeoCAT-comp structure is split into two repositories with respect to being either pure-Python or Python with compiled code (i.e. Fortran) implementations. Such implementation layers are handled with the GeoCAT-comp and GeoCAT-f2py repositories, respectively.
GeoCAT-comp code-base does not explicitly contain or require any compiled code, making it more accessible to the general Python community at large. In addition, GeoCAT-f2py is automatically installed through GeoCAT-comp installation, and all functions contained in the “geocat.f2py” package are imported transparently into the “geocat.comp” namespace. Thus, GeoCAT-comp serves as a user API to access the entire computational toolkit even though its GitHub repository itself only contains pure Python code from the developer’s perspective. Whenever prospective contributors want to contribute computational functionality in pure Python, GeoCAT-comp is the only GitHub repository they need to deal with. Therefore, there is no onus on contributors of pure Python code to build, compile, or test any compiled code (e.g. Fortran) at GeoCAT-comp level.
GeoCAT-examples (and GeoCAT-viz)
GeoCAT-examples GeoCAT-examples GitHub repository, n.d. was created to address a few of the original milestones of NCAR’s “Pivot to Python” initiative: (1) to provide the geoscience community with well-documented visualization examples for several plotting classes in the SPE, and (2) to help transition NCL users into the Python ecosystem through providing such resources. It was born in early 2020 as the result of a multi-day hackathon event among the GeoCAT team and several other scientists and developers from various NCAR labs/groups. It has since grown to house novel visualization examples and showcase the capabilities of other GeoCAT components, like GeoCAT-comp, along with newer technologies like interactive plotting notebooks. Figure 5 illustrates one of the unique GeoCAT-examples cases that was aimed at exploring the best practices for data visualization like choosing color blind friendly colormaps.
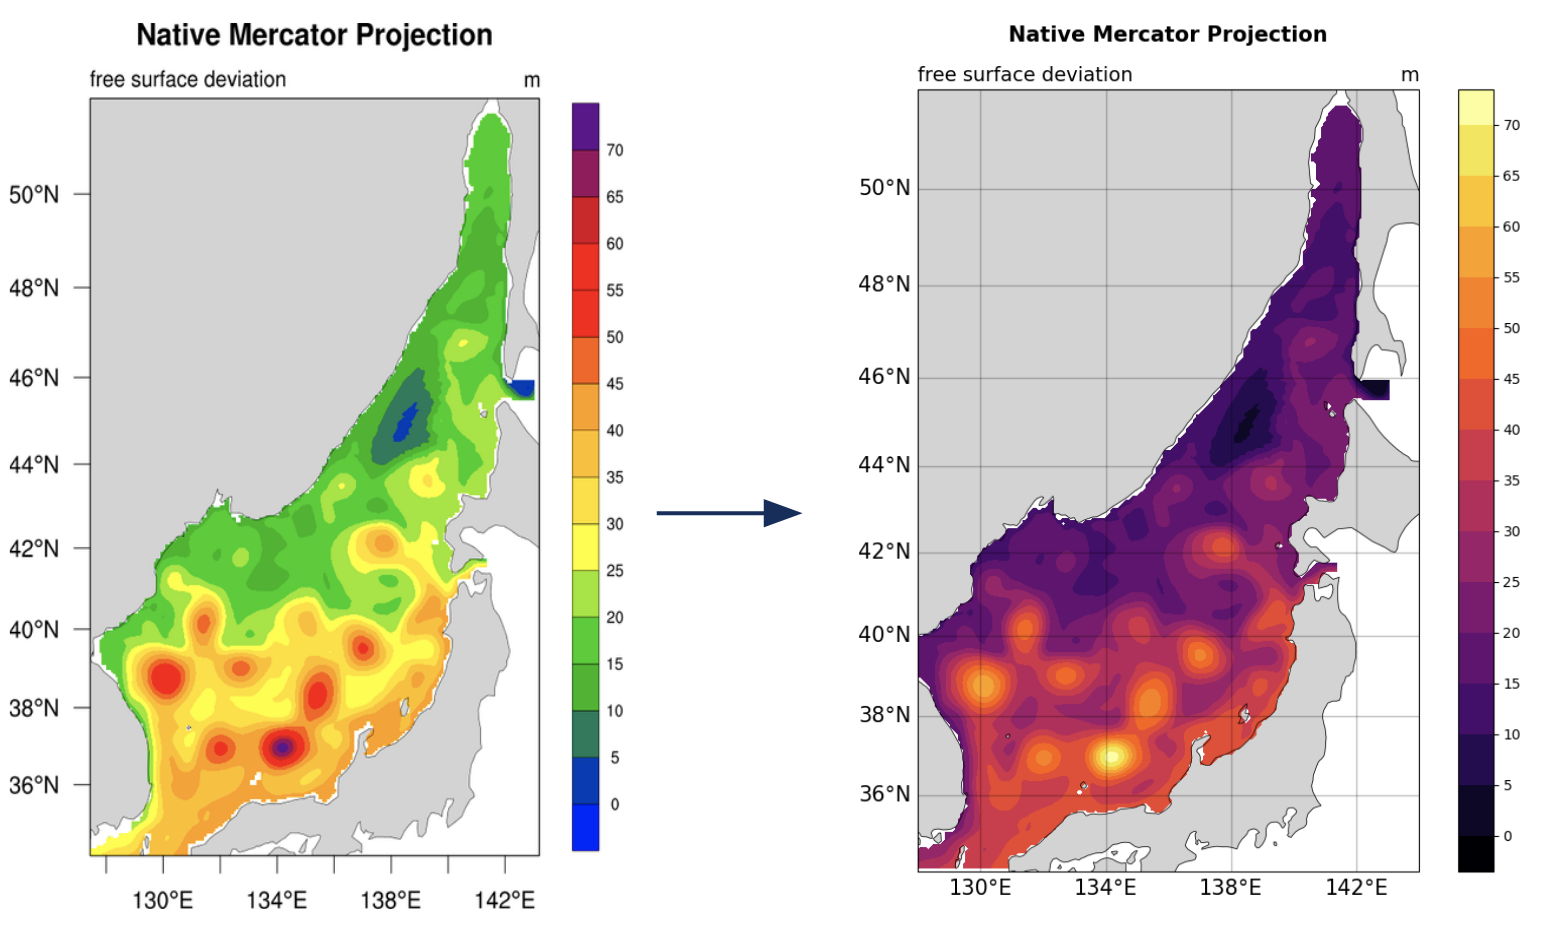
Figure 5:Comparison between NCL (left) and Python (right) when choosing a colormap; GeoCAT-examples aiming at choosing color blind friendly colormaps Sizemore et al., 2022
The GeoCAT-examples GeoCAT-examples documentation page, n.d. gallery contains over 140 example Python plotting scripts, demonstrating functionalities from Python packages like Matplotlib, Cartopy, Numpy, and Xarray. The gallery includes plots from a range of visualization categories such as box plots, contours, meteograms, overlays, projections, shapefiles, streamlines, and trajectories among others. The plotting categories and scripts under GeoCAT-examples cover almost all of the NCL plot types and techniques. In addition, GeoCAT-examples houses plotting examples for individual GeoCAT-comp analysis functions.
Despite Matplotlib and Cartopy’s capabilities to reproduce almost all of NCL plots, there was one significant caveat with using their low-level implementations against NCL: NCL’s high-level plotting functions allowed scientists to plot most of the cases in only tens of lines of codes (LOC) while the Matplotlib and Cartopy stack required writing a few hundred LOC. In order to build a higher-level implementation on top of Matplotlib and Cartopy while recreating the NCL-like plots (from vital plotting capabilities that were not readily available in the Python ecosystem at the time such as Taylor diagrams and curly vectors to more stylistic changes such as font sizes, color schemes, etc. that resemble NCL plots), the GeoCAT-viz library GeoCAT-viz GitHub repository, n.d. was implemented. Use of functions from this library in GeoCAT-examples significantly reduces the LOC requirements for most of the visualization examples to comparable numbers to those of NCL’s. Figure 6 shows Taylor diagram and curly vector examples that have been created with the help of GeoCAT-viz. To exemplify how GeoCAT-viz helps keep the LOC comparable to NCL, one of the Taylor diagrams (i.e. Taylor_6) took 80 LOC in NCL, and its Python implementation in GeoCAT-examples takes 72 LOC. If many of the Matplotlib functions (e.g. figure and axes initialization, adjustment of several axes parameters, call to plotting functions for Taylor diagram, management of grids, addition of titles, contours, etc.) used in this example weren’t wrapped up in GeoCAT-viz GeoCAT-viz GitHub repository, n.d., the same visualization would easily end up in around two hundred LOC.
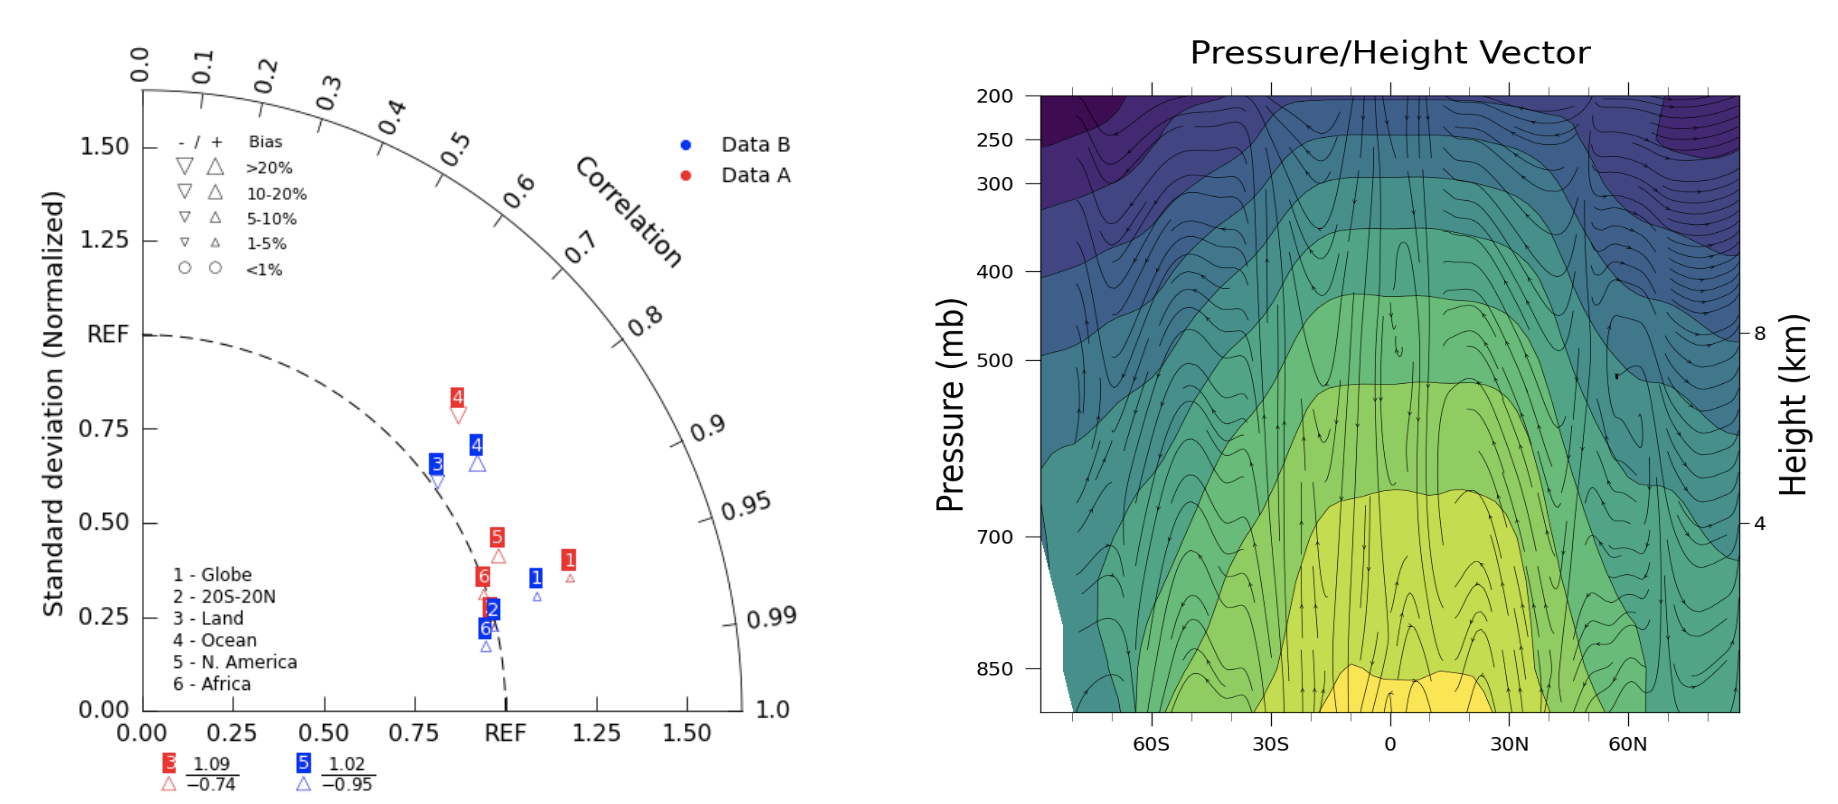
Figure 6:Taylor diagram and curly vector examples that created with the help of GeoCAT-viz
Recently, the GeoCAT team has been focused on interactive plotting technologies, especially for larger data sets that contain millions of data points. This effort was centered on unstructured grid visualization as part of Project Raijin, which is detailed in a later section in this manuscript. That is because unstructured meshes are a great research and application field for big data and interactivity such as zoom in/out for regions of interest. As a result of this effort, we created a new notebooks gallery under GeoCAT-examples to house such interactive data visualizations. The first notebook, a screenshot from which is shown in Figure 7, in this gallery is implemented via the Datashader and Holoviews ecosystem Anaconda, n.d., and it provides a high-performance, interactive visualization of a Model for Prediction Across Scales (MPAS) Global Storm-Resolving Model weather simulation dataset. The interactivity features are pan and zoom to reveal greater data fidelity globally and regionally. The data used in this work is the courtesy of the DYAMOND effort Stevens et al., 2019 and has varying resolutions from 30 km to 3.75 km. Our notebook in the gallery uses the 30 km resolution data for the users to be able to download and work on it in their local configuration. However, our work with the 3.75 km resolution data (i.e. about 42 million hexagonal cells globally) showed that rendering the data took only a few minutes on a decent laptop, even without any parallelization. The main reason behind such a high performance was that we used the cell-to-node connectivity information in the MPAS data to render the native grid directly (i.e. without remapping to the structured grid) along with utilizing the Datashader stack. Without using the connectivity information, it would require to run much costly Delaunay triangulation. The notebook provides a comparison between these two approaches as well.
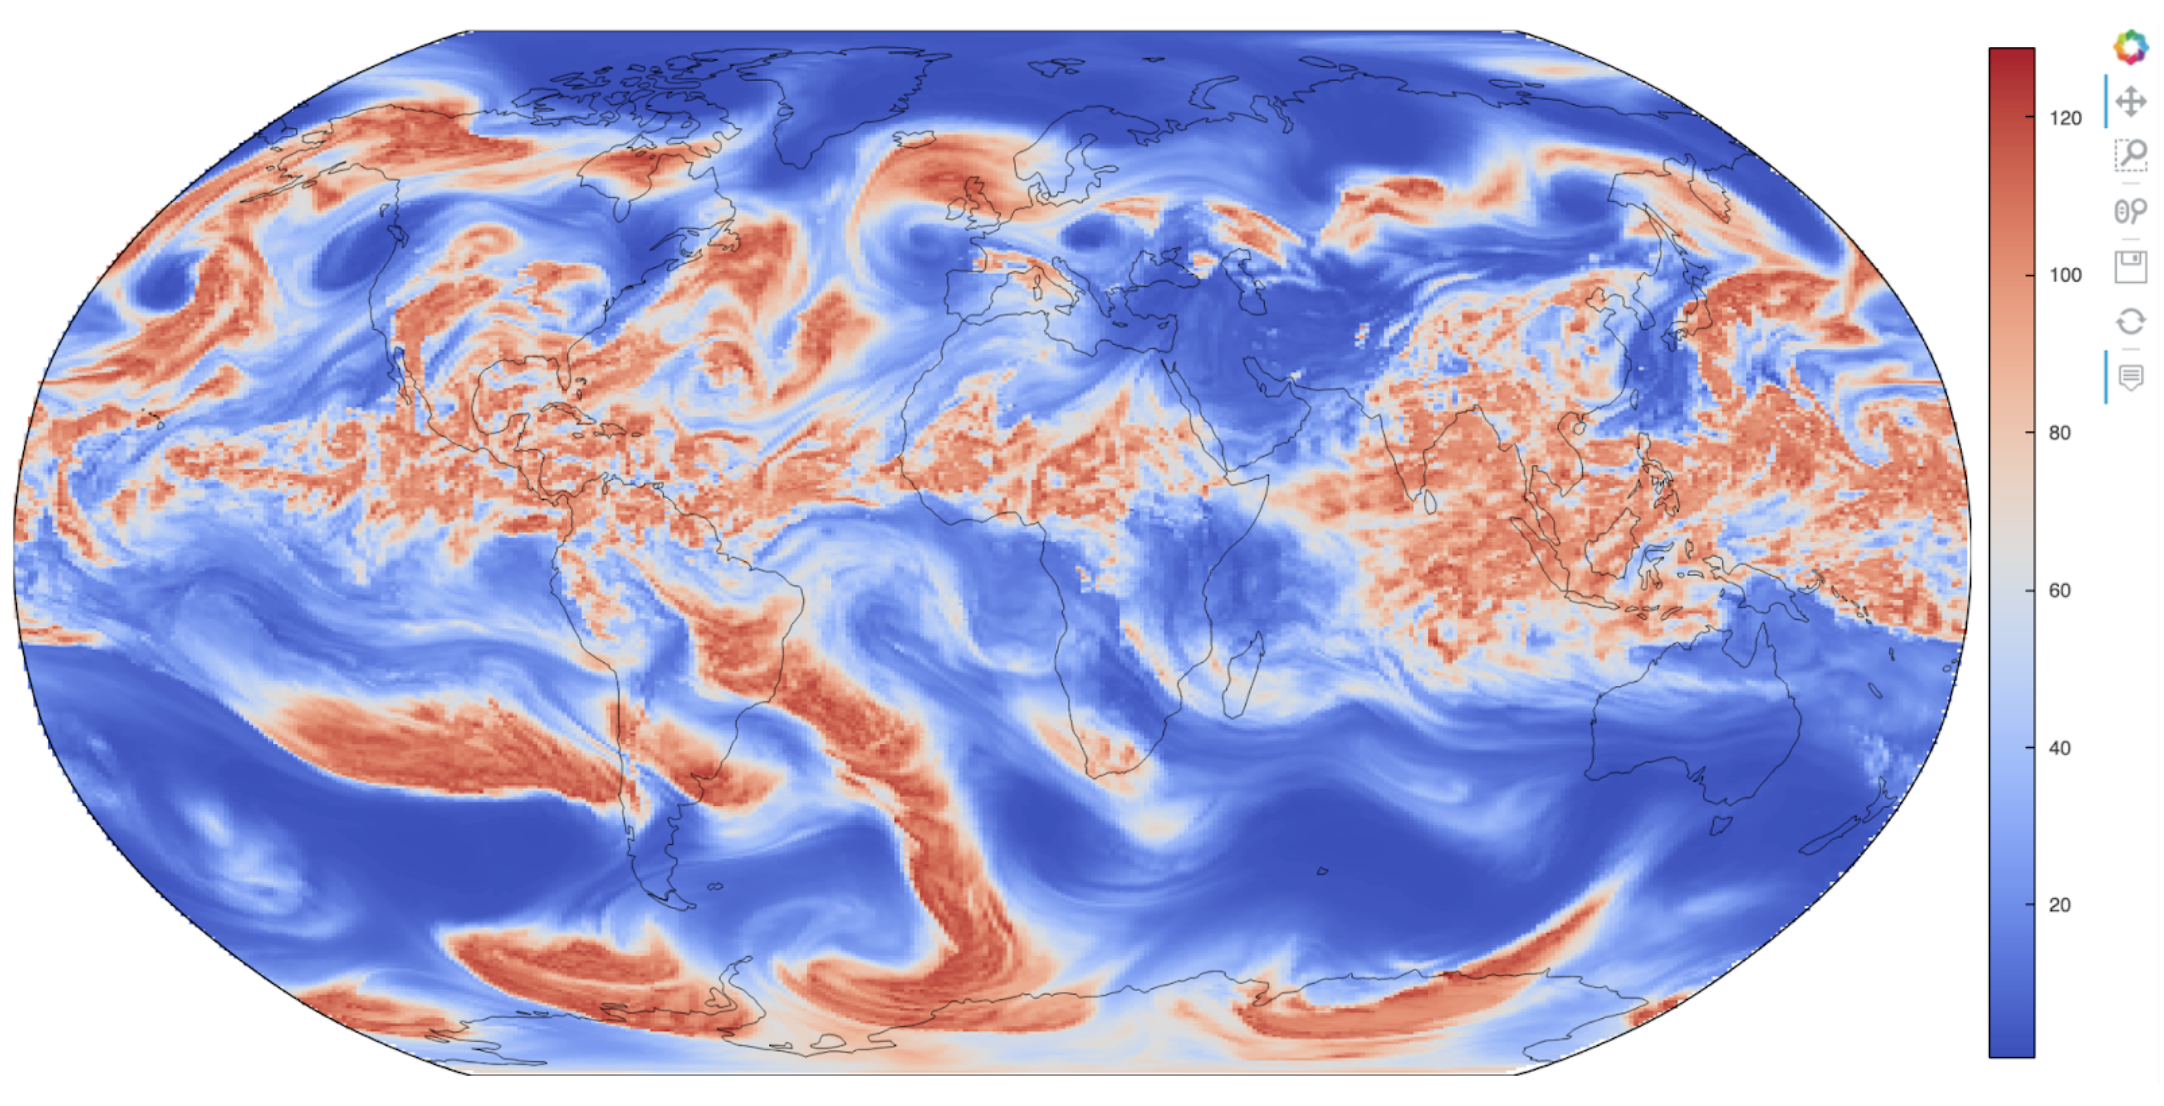
Figure 7:The interactive plot interface from the MPAS visualization notebook in GeoCAT-examples
GeoCAT-datafiles
GeoCAT-datafiles is GeoCAT’s small data storage component as a Github repository. This tool houses many datasets in different file formats such as NetCDF, which can be used along with other GeoCAT tools or ad-hoc data needs in any other Python script. The datasets can be accessed by the end-user through a lightweight convenience function:
geocat.datafiles.get("folder_name/filename")GeoCAT-datafiles fetches the file by simply reading from the local storage, if any, or downloading from the GeoCAT-datafiles repository, if not in the local storage, with the help of Pooch framework Uieda et al., 2020.
WRF-Python
WRF-Python was created in early 2017 in order to replicate NCL’s Weather Research and Forecasting (WRF) package in the SPE, and it covers 100% of the routines in that package. About two years later, NCAR’s “Pivot to Python” initiative was announced, and the GeoCAT team has taken over development and maintenance of WRF-Python.
The package focuses on creating a Python package that eliminates the need to work across multiple software platforms when using WRF datasets. It contains more than 30 computational (e.g. diagnostic calculations, several interpolation routines) and visualization routines that aim at reducing the amount of post-processing tools necessary to visualize WRF output files.
Even though there is no continuous development in WRF-Python, as is seen in the rest of the GeoCAT stack, the package is still maintained with timely responses and bug-fix releases to the issues reported by the user community.
Project Raijin
“Collaborative Research: EarthCube Capabilities: Raijin: Community Geoscience Analysis Tools for Unstructured Mesh Data”, i.e. Project Raijin, of the consortium between NCAR and Pennsylvania State University has been awarded by NSF 21-515 EarthCube for an award period of 1 September, 2021 - 31 August, 2024 NSF, 2021. Project Raijin aims at developing community-owned, sustainable, scalable tools that facilitate operating on unstructured climate and global weather data Raijin homepage, n.d.. The GeoCAT team is in charge of the software development of Project Raijin, which mainly consists of implementing visualization and analysis functions in the SPE to be executed on native grids. While doing so, GeoCAT is also responsible for establishing an open development environment, clearly documenting the implementation work, and aligning deployments with the project milestones as well as SPE requirements and specifications.
GeoCAT has created the Xarray-based Uxarray package UXarray GitHub repository, n.d. to recognize unstructured grid models through partnership with geoscience community groups. UXarray is built on top of the built-in Xarray Dataset functionalities while recognizing several unstructured grid formats (UGRID, SCRIP, and Exodus for now). Since there are more unstructured mesh models in the community than UXarray natively supports, its architecture will also support addition of new models. Figure 8 shows the regularly structured “latitude-longitude” grids versus a few unstructured grid models.
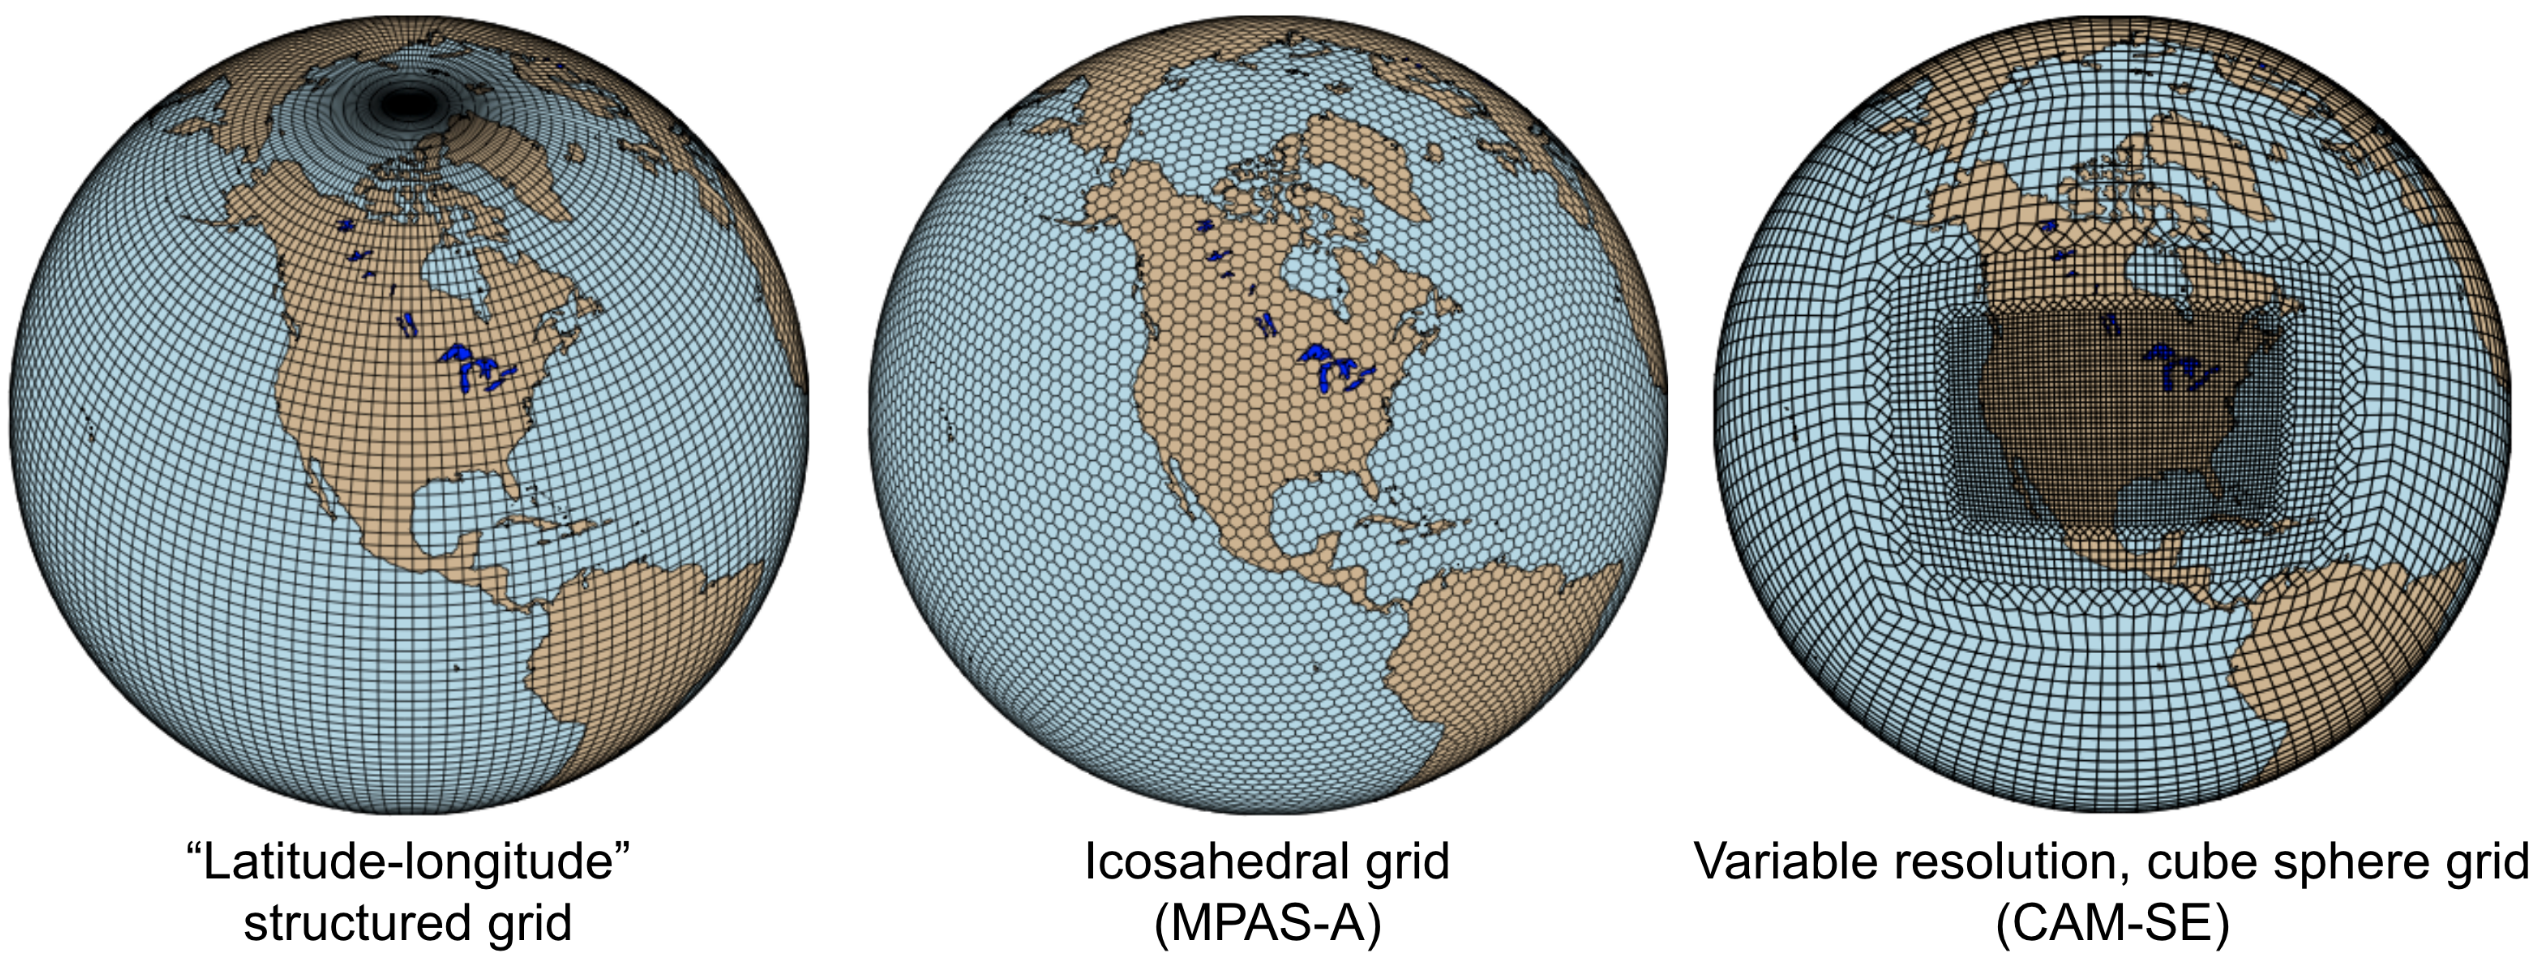
Figure 8:Regular grid (left) vs MPAS-A & CAM-SE grids
The UXarray project has implemented data input/output functions for UGRID, SCRIP, and Exodus, as well as methods for surface area and integration calculations so far. The team is currently conducting open discussions (through GitHub Discussions) with community members, who are interested in unstructured grids research and development in order to prioritize data analysis operators to be implemented throughout the project lifecycle.
Scalability
GeoCAT is aware of the fact that today’s geoscientific models are capable of generating huge sizes of data. Furthermore, these datasets, such as those produced by global convective-permitting models, are going to grow even larger in size in the future. Therefore, computational and visualization functions that are being developed in the geoscientific research and development workflows need to be scalable from personal devices (e.g. laptops) to HPC (e.g. NCAR’s Casper, Cheyenne, and upcoming Derecho clusters) and cloud platforms (e.g. AWS).
In order to keep up with the scalability objectives, GeoCAT functions are implemented to operate on Dask arrays in addition to natively supporting NumPy arrays and Xarray DataArrays. Therefore, the GeoCAT functions can trivially and transparently be parallelized to be run on shared-memory and distributed-memory platforms after having Dask cluster/client properly configured and functions fed with Dask arrays or Dask-backed Xarray DataArrays (i.e. chunked Xarray DataArrays that wrap up Dask arrays).
Open Development
To ensure community involvement at every level in the development lifecycle, GeoCAT is committed to an open development model. In order to implement this model, GeoCAT provides all of its software tools as GitHub repositories with public GitHub project boards and roadmaps, issue tracking and development reviewing, comprehensive documentation for users and contributors such as Contributor’s Guide GeoCAT Contributor's Guide, n.d. and toolkit-specific documentation, along with community announcements on the GeoCAT blog. Furthermore, GeoCAT encourages community feedback and contribution at any level with inclusive and welcoming language. As a result of this, community requests and feedback have played significant role in forming and revising the GeoCAT roadmap and projects’ scope.
Community engagement
To further promote engagement with the geoscience community, GeoCAT organizes and attends various community events. First of all, scientific conferences and meetings are great venues for such a scientific software engineering project to share updates and progress with the community. For instance, the American Meteorological Society (AMS) Annual Meeting and American Geophysical Union (AGU) Fall Meeting are two significant scientific events that the GeoCAT team presented one or multiple publications every year since its birth to inform the community. The annual Scientific Computing with Python (SciPy) conference is another great fit to showcase what GeoCAT has been conducting in geoscience. The team also attended The International Conference for High Performance Computing, Networking, Storage, and Analysis (SC) a few times to keep up-to-date with the industry state-of-the-arts in these technologies.
Creating internship projects is another way of improving community interactions as it triggers collaboration through GeoCAT, institutions, students, and university in general. The GeoCAT team, thus,encourages undergraduate and graduate student engagement in the Python ecosystem through participation in NCAR’s Summer Internships in Parallel Computational Science (SIParCS). Such programs are quite beneficial for both students and scientific software development teams. To exemplify, GeoCAT-examples and GeoCAT-viz in particular has received significant contributions through SIParCS in 2020 and 2021 summers (i.e. tens of visualization examples as well as important infrastructural changes were made available by our interns) Craker et al., 2022Lincoln et al., 2021Craker et al., 2021. Furthermore, the team has created three essential and one collaboration project through SIParCS 2022 summer through which advanced geoscientific visualization, unstructured grid visualization and data analysis, Fortran to Python algorithm and code development, as well as GPU optimization for GeoCAT-comp routines will be investigated.
Project Pythia
The GeoCAT effort is also a part of the NSF funded Project Pythia. Project Pythia aims to provide a public, web-accessible training resource that could help educate earth scientists to more effectively use the SPE and cloud computing for dealing with big data in geosciences. GeoCAT helps with Pythia development through content creation and infrastructure contributions. GeoCAT has also contributed several Python tutorials (such as Numpy, Matplotlib, Cartopy, etc.) to the educational resources created through Project Pythia. These materials consist of live tutorial sessions, interactive Jupyter notebook demonstrations, Q&A sessions, as well as published video recording of the event on Pythia’s Youtube channel. As a result, it helps us engage with the community through multiple channels.
Future directions
GeoCAT aims to keep increasing the number of data analysis and visualization functionalities in both structured and unstructured meshes with the same pace as has been done so far. The team will continue prioritizing scalability and open development in future development and maintenance of its software tools landscape. To achieve the goals with scalability of our tools, we will ensure our implementations are compatible with the state-of-the-art and up-to-date with the best practices of the technology we are using, e.g. Dask. To enhance the community involvement in our open development model, we will continue interacting with the community members through significant events such as Pangeo community meetings, scientific conferences, tutorials and workshops of GeoCAT’s own as well as other community members; we will keep our timely communication with the stakeholders through GitHub assets and other communication channels.
Copyright © 2022 Eroglu et al. This is an open-access article distributed under the terms of the Creative Commons Attribution 3.0 Unported license.
- AGU
- American Geophysical Union
- AMS
- American Meteorological Society
- CI/CD
- continuous delivery/deployment
- EOF
- empirical orthogonal function
- GeoCAT
- Geoscience Community Analysis Toolkit
- HPC
- high performance computing
- JIT
- just-in-time
- LOC
- lines of code
- NCAR
- National Center for Atmospheric Research
- NCL
- NCAR Command Language
- SciPy
- Scientific Computing with Python
- SIParCS
- Summer Internships in Parallel Computational Science
- SPE
- Scientific Python Ecosystem
- GeoCAT. (2019). The Future of NCL and the Pivot to Python. http://dx.doi.org/10.5065/D6WD3XH5
- Brown, D., Brownrigg, R., Haley, M., & Huang, W. (2012). NCAR Command Language (ncl). UCAR/NCAR-Computational and Information Systems Laboratory (CISL). http://dx.doi.org/10.5065/D6WD3XH5
- Hamman, J., Rocklin, M., & Abernathy, R. (2018). Pangeo: A big-data ecosystem for scalable earth system science.
- Hoyer, S., & Hamman, J. (2017). xarray: N-D labeled arrays and datasets in Python. Journal of Open Research Software, 5(1), 10. http://doi.org/10.5334/jors.148
- Matthew Rocklin. (2015). Dask: Parallel Computation with Blocked algorithms and Task Scheduling. In Kathryn Huff & James Bergstra (Eds.), Proceedings of the 14th Python in Science Conference (pp. 126–132). 10.25080/Majora-7b98e3ed-013
- Craker, H., Kootz, A., Zacharias, A., Sizemore, M., & Eroglu, O. (2022). NCAR’s GeoCAT Announcement of Computational Tools. 102nd American Meteorological Society Annual Meeting.
- Lam, S. K., Pitrou, A., & Seibert, S. (2015). Numba: A llvm-based python jit compiler. Proceedings of the Second Workshop on the LLVM Compiler Infrastructure in HPC, 1–6. https://doi.org/10.1145/2833157.2833162
- Hunter, J. D. (2007). Matplotlib: A 2D graphics environment. Computing in Science & Engineering, 9(3), 90–95. 10.1109/MCSE.2007.55
- Met Office. (2010 - 2015). Cartopy: a cartographic python library with a matplotlib interface. http://scitools.org.uk/cartopy
- Anaconda. (n.d.). Datashader. https://datashader.org/
- NSF. (2021). Collaborative Research: EarthCube Capabilities: Raijin: Community Geoscience Analysis Tools for Unstructured Mesh Data. https://nsf.gov/awardsearch/showAward?AWD_ID=2126458&HistoricalAwards=false
- Clyne, J., Eroglu, O., Medeiros, B., & Zarzycki, C. M. (2021). Project Raijin: Community Geoscience Analysis Tools for Unstructured Grids. AGU Fall Meeting 2021.
- Anaconda, Inc. (n.d.). Conda package manager. https://docs.conda.io/en/latest/
- Python Software Foundation. (n.d.). The Python Package Index - PyPI. https://pypi.org/
- GitHub. (n.d.). GitHub Actions. https://docs.github.com/en/actions
